

Content Hub Audit: Indexing, Intent, and Search Evidence

Platform Behavior: A Two-Month Organic Publishing Audit
An asynchronous job pipeline can appear healthy while quietly failing to honor the work that arrives. Its workers may continue completing jobs, its queue may never exceed a configured limit, and its latency charts may even improve. None of those observations tells me what happened to the requests that had to wait, were refused at admission, or were accepted and later discarded. To evaluate backpressure responsibly, I need to account for the entire demand stream, not just the convenient subset that eventually reaches a worker.
For this backpressure study, I used a working, instrumented Python asyncio pipeline and a frozen set of short synthetic-I/O workloads. The experiment compared blocking the producer, rejecting new work, and shedding the oldest queued work. It also varied worker counts, queue capacity, traffic pattern, and retry pressure. The 81 main runs were executed, their raw events retained, and their reported metrics independently replayed. These are measurements of a local model, not a benchmark of a distributed queue, a cloud platform, or a production service.
If you only read one thing: At four workers and a queue capacity of 32, all three admission policies reached the same queue-depth limit under overload. Yet the blocking policy eventually completed all 2,532 offered jobs across three repetitions, explicit rejection refused 869, and drop-oldest shedding later removed 868 previously accepted jobs. The policies’ in-window completion rates were close. Choosing an overload policy from throughput or completed-job p95 alone would conceal a substantial difference in what the system promised to do.
The Decision: What Should Give Way When Work Arrives Too Fast?
A job pipeline has at least two rates worth distinguishing: the rate at which work is offered and the rate at which the system can complete work under a given service model. When offered demand exceeds sustainable processing capacity, the excess must appear somewhere. It may accumulate in an unbounded backlog, delay an upstream producer, receive an explicit rejection, or be discarded according to a documented policy. Increasing concurrency helps only while capacity exists somewhere else; it does not erase the need for an admission decision.
In this article, I use backpressure in its operational sense: a mechanism that prevents unchecked growth of pending work by making the producer, caller, or workload policy confront the limits of downstream capacity. A positive maxsize on an asyncio.Queue bounds items waiting in that queue. It does not automatically bound upstream requests, running tasks, retry work, precomputed input arrays, or process memory. That distinction is central to the test.
The practical backpressure questions were deliberately narrow. What changes when the same offered schedule meets three admission policies? Does a larger queue reduce loss at the cost of waiting? What happens when a short burst subsides? How should we interpret retries that keep a worker occupied? And when a p95 chart looks better, did service improve or did the population being measured change?
Decision Brief
| Decision dimension | What I measure | What the measurement cannot decide alone |
|---|---|---|
| Queue protection | Maximum depth relative to 32 or 128 waiting jobs | Whether upstream pending demand or total process memory is bounded |
| Delivery outcome | Completed, rejected, shed, failed, and cancelled jobs | Whether a real business operation was durably committed |
| Responsiveness | Queue wait, producer blocking, schedule lag, end-to-end completion time | Whether excluded work would have had acceptable latency |
| Capacity | In-window completions and full-drain throughput | Long-run throughput of databases, networks, or durable brokers |
| Failure behavior | Retry attempts, terminal failures, dead-letter records | Failure recovery after a host crash or a network partition |
My backpressure criterion is not that one column contains the highest number. It is whether the chosen policy makes its consequences explicit and matches the value, age sensitivity, and recovery expectations of the work.
What Was Actually Built and Executed
The measured backpressure system was a single-process, in-memory FIFO, implemented with Python’s standard library. One producer followed a predetermined schedule. A fixed pool of one, four, or eight workers removed queued jobs and performed an asynchronous sleep lasting a nominal 10–14 milliseconds per attempt. The sleep is an intentional synthetic I/O stand-in, allowing the lab to examine queue and scheduling behavior without external services or real user data.
The host was an arm64 Mac running macOS 27.2 and CPython 3.14.8. Each repetition ran in a fresh interpreter process. The study retained six separate saturation pilots, 81 frozen main runs, and 16 automated correctness tests. Three matched-seed repetitions covered each of 27 main configurations. All 16 tests passed in the original execution record; the evidence verifier subsequently replayed the lifecycle data independently of the worker implementation.
| Study component | Observed scope |
|---|---|
| Pilot runs | 6, separate from main analysis |
| Main configurations | 27, including policy, traffic pattern, worker count, and queue size |
| Main repetitions | 3 per configuration, with matched seeds |
| Main runs | 81 |
| Main submissions | 49,356 |
| Main successful completions | 40,618 |
| Main explicit rejections | 4,293 |
| Main post-acceptance evictions | 4,263 |
| Main terminal processing failures | 182 |
| Main processing attempts | 41,571 |
| Main lifecycle and instrumentation events | 473,337 |
| Additional pilot events | 47,712 |
These totals aggregate different experimental configurations and repeated workloads; they are not a single production traffic stream. A job counted in one configuration is not evidence of a distinct real customer request. Similarly, the count of 16 passing tests describes the tested code paths, not a quantified code-coverage percentage or formal proof of crash safety.
The Queue Is Bounded; the System Is Not Automatically Bounded
In this backpressure test, queue capacity applies to jobs that have been enqueued but not acquired by workers. A worker may own a job, including during retry backoff, without that job occupying a queue slot. With four workers and a queue size of 32, up to 32 jobs can wait in the FIFO while four additional jobs are in worker ownership. A producer can also be paused while trying to admit the next submission.
This is the first reason backpressure requires more than choosing a queue length. A bounded internal waiting room is useful, but its safety story depends on the boundaries around it: who may generate new requests, how outstanding demand is represented, which actions are acknowledged, and how shutdown accounts for unfinished work.
The documented API behavior helps establish the backpressure mechanism precisely. await queue.put(item) waits for capacity when a positive maxsize is reached; put_nowait() raises QueueFull instead. The lab’s drop-oldest policy explicitly removed a queued item before admitting a new one. Those actions are different application policies built around the same FIFO abstraction. Python’s asyncio queue documentation defines the underlying API semantics.
A Frozen Test Matrix Instead of an Optimized Demo
Before the main backpressure runs, six calibration trials estimated short-window processing capacity under saturation for one, four, and eight workers, using a queue capacity of 32. The observed median completions per second were 76.79, 319.64, and 649.64 respectively during 1.4-second pilot windows. Those numbers calibrate the synthetic workload on this host; they do not establish a durable service-level capacity.
The four-worker pilot informed three constant-rate schedules: 176 planned jobs/s for stable traffic, 297 for near-capacity traffic, and 527 for overload. Because arrivals are discretized, the overload schedule contained exactly 844 planned jobs in a 1.600-second window, equivalent to 527.50 scheduled jobs/s for that window. The main experiment also included a burst case and a fault-injected retry case.
Conditions and Controls
| Variable | Frozen design |
|---|---|
| Admission strategy | Block producer; reject new work; evict oldest queued job |
| Main workers | 4, plus 1 and 8 in the overload scaling comparison |
| Queue capacity | 32, plus 128 in overload and burst comparisons |
| Main traffic patterns | Stable, near-capacity, sustained overload, short burst, retry with injected faults |
| Sampling | Three seed-matched repetitions for each of 27 configurations |
| Main timing window | 1.600 seconds, with work allowed to drain afterward |
| Job model | Synthetic asynchronous timer, nominally 10–14 ms per attempt |
| Processing timeout | 80 ms cooperative attempt deadline, not hit in main runs |
| Retry rule | At most three attempts, with bounded 8 and 16 ms backoff intervals |
| Percentile calculation | Nearest rank; minimum sample sizes set before testing |
The frozen backpressure design also established run limits, source fingerprints, workload seeds, acceptance criteria, and failure accounting. No main observations were quietly excluded as outliers. I regard the fixed plan as a defense against choosing favorable test runs after seeing the outcome. It does not remove operating-system scheduler variability or make three repetitions a statistical sample of all future workloads.
How the Burst Was Constructed
The burst schedule offered approximately 144 jobs/s outside a 180-millisecond peak, with a peak configured around 1,279 jobs/s between 550 and 730 milliseconds. It is a finite surge with a lower-rate tail, not an endlessly overloaded service. This design matters because backpressure that postpones producer submissions can catch up when pressure subsides. A sustained-overload result cannot simply be copied over to a short-burst recovery scenario.
Four Different Clocks Prevent a False Performance Story
For backpressure analysis, a single number called “latency” is not enough. The workload defines a planned arrival time and the running system records an actual submission time. It also records admission, enqueue, worker acquisition, processing attempts, and terminal outcomes. A blocked producer may submit a job long after its planned due time. An accepted job may spend time in the FIFO before a worker touches it. These are different sources of delay.
- Schedule lag is the time between the predetermined due timestamp and actual submission. It exposes work the producer has not yet been able to hand to admission control.
- Producer blocking time is the duration of actual capacity waits while a producer tries to enqueue.
- Queue waiting time is the time from successful enqueue to worker acquisition. A rejected arrival has no queue-wait sample, and a shed job that never reaches a worker is also excluded.
- Completed-job end-to-end time runs from actual submission to terminal completion. It does not include pre-submission schedule lag.
- Processing attempt time measures execution attempts, including the effects of timer scheduling and instrumentation rather than an assumed fixed sleep.
This decomposition is not academic bookkeeping. Under producer blocking, in-queue p95 can remain controlled while the producer falls behind its schedule. Under rejection or shedding, queue-wait p95 can appear relatively short because a fraction of offered work never contributes a waiting-time sample. The metric’s denominator changes along with the policy.
The backpressure harness used time.perf_counter_ns() for monotonic elapsed time and a nearest-rank percentile calculation. It required at least 100 samples before reporting p95 and 500 before reporting p99. These thresholds avoid dressing up a handful of observations as a reliable tail estimate. They cannot remove bias from which jobs were admitted or acquired.
What Happens Under Sustained Overload at Queue Capacity 32?
This is the central backpressure comparison. Four workers faced the same planned 844-job schedule in each of three matched repetitions, with a 32-job maximum waiting queue. The offered workload therefore totaled 2,532 jobs per policy across three runs. At this pressure, all three policies filled the queue. In the second repetition, the waiting queue first reached capacity about 163 milliseconds into the run.
| Policy | Median completions/s within 1.6 s | Median queue-wait p95 | Completed across three runs | Rejected | Shed after acceptance |
|---|---|---|---|---|---|
| Block producer | 318.75 | 104.23 ms | 2,532 | 0 | 0 |
| Reject new work | 325.00 | 100.59 ms | 1,663 | 869 | 0 |
| Shed oldest queued | 324.38 | 66.59 ms | 1,664 | 0 | 868 |
Important reading rule: The throughput figures are medians of successful completions in the fixed window; the completed/rejected/shed numbers are totals across all three runs, including post-window drain where applicable. Do not divide the three-run totals by 1.6 seconds or treat completed totals as in-window completions.
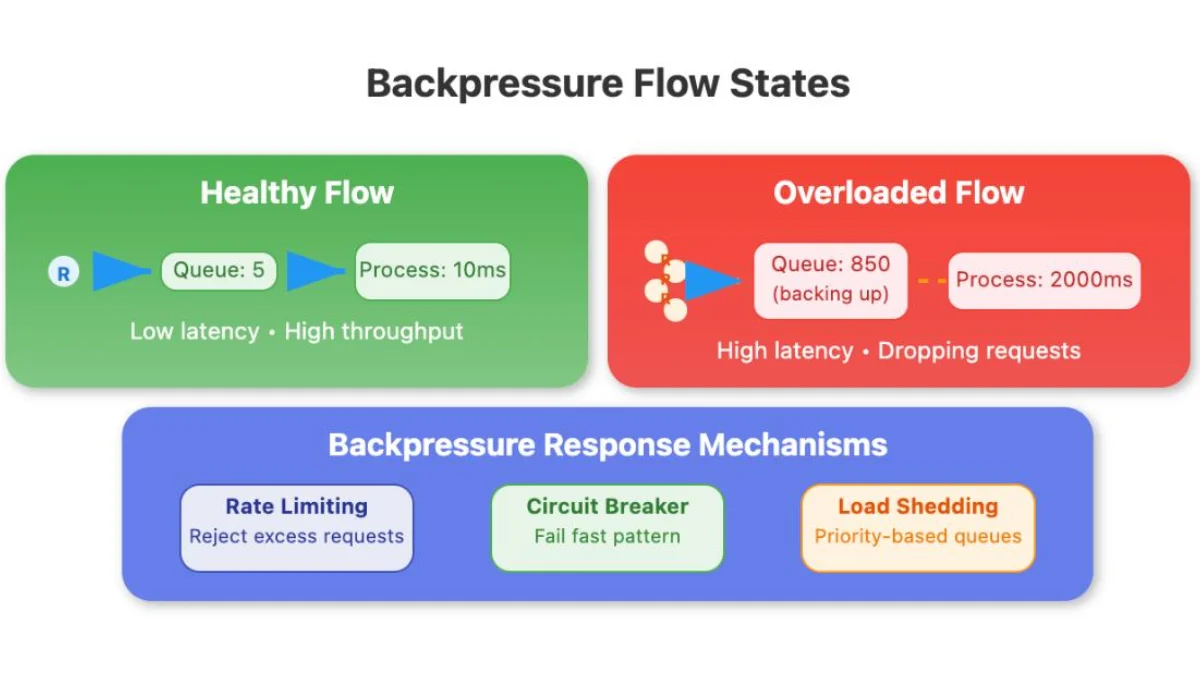
Measured SD-09 overload outcomes. Job totals combine three repetitions; queue-wait p95 and window completion rates are medians. Rejected or shed work does not enter the successful-worker wait population.
The similar completion rates across backpressure policies are the first warning against a simplistic throughput ranking. Their observed ranges overlap or touch: block ranged from 318.12 to 320.62 jobs/s, reject from 320.62 to 326.25, and shed from 321.25 to 326.88. These measurements do not demonstrate a stable production advantage for rejection or shedding. The much larger distinction is what happened to the offered work.
Blocking Moved Pressure Upstream
The block policy accepted and ultimately completed all 2,532 offered jobs in its finite three-run test. It did not accomplish that by processing all the jobs within the 1.6-second window. Each repetition submitted another 294–298 scheduled jobs after the cutoff, and the full run took about 2.64–2.65 seconds to finish. The median actual in-window submission rate fell to 341.88 jobs/s despite the 527.50 jobs/s planned schedule.
Its median capacity-wait p95 was 11.03 ms per individual blocking episode, while its median planned-to-actual submission-lag p95 reached 876.10 ms. Those numbers are not contradictory: repeated pauses can push later scheduled arrivals far behind time. Backpressure protected the bounded FIFO in this experiment, but it displaced the queueing cost into producer scheduling and post-window drain. A real upstream caller or unbounded submission buffer might still accumulate more work than the in-process queue can show.
Rejection Made Loss Explicit at Admission
The explicit-rejection backpressure policy refused 869 of 2,532 offered jobs, approximately 34.3%. The accepted 1,663 completed in the experiment. The rejection was immediate and identifiable in the lifecycle record; it was not silently hidden inside a “successful request” count. Its median queue-wait p95 among acquired work was 100.59 ms, close to block’s in-queue p95, but the measured population was smaller.
For a production application, explicit refusal is useful only if the caller knows how to respond. Retry immediately without a limit, and a clean backpressure boundary can become a self-amplifying demand loop. Return a meaningful retry-after signal, shed optional work before making a durable promise, or choose a deliberate deferred-recovery path as appropriate. The lab measured refusal, not a real client recovery protocol.
Shedding Protected Fresher Queued Work by Discarding Older Work
The drop-oldest backpressure policy accepted all 2,532 submissions, but later evicted 868 previously accepted jobs, also about 34.3%. Its remaining 1,664 completed. The oldest queued job was removed on saturation; a running worker’s job was not interrupted by that policy. Median queue-wait p95 fell to 66.59 ms among jobs that actually reached workers.
That number is meaningful but conditional. It does not show that the complete offered population enjoyed lower latency. A discarded item has no successful completion and may have represented essential work. This kind of backpressure is a plausible design choice for replaceable telemetry snapshots or live-refresh requests, not an acceptable default for payments, audit records, or once-only obligations. Whether any job is safely supersedable is an application contract, not a queue performance property.
Why a Larger Queue Was Not a Free Improvement
The backpressure overload comparison was repeated at a capacity of 128 waiting jobs, still with four workers and the same offered schedule. The larger waiting room retained more work before rejecting or evicting it. It also allowed much longer waits for the jobs that survived.
| Policy | Q32 p95 queue wait | Q128 p95 queue wait | Q32 rejected / shed | Q128 rejected / shed |
|---|---|---|---|---|
| Block | 104.23 ms | 406.41 ms | 0 / 0 | 0 / 0 |
| Reject | 100.59 ms | 397.00 ms | 869 / 0 | 573 / 0 |
| Shed | 66.59 ms | 356.97 ms | 0 / 868 | 0 / 570 |
For rejection, increasing capacity from 32 to 128 reduced explicit refusals by 296 across three repetitions while the p95 queue wait rose from 100.59 to 397.00 milliseconds. Shedding likewise removed fewer jobs but made surviving work wait longer. The block policy already preserved the finite offered workload; enlarging its queue chiefly shifted delay from producer scheduling to time spent inside the FIFO.
This is the queue-capacity trade-off of backpressure in concrete terms. More buffering can absorb a burst or retain additional work, but it does not raise the worker pool’s intrinsic service rate. If latency matters, a larger buffer can make more jobs eligible to wait beyond their useful deadline. If preservation matters, a shorter queue can cause unacceptable refusals. Backpressure policy and queue size must be designed together, with expiry, retry, and recovery contracts attached.
A Short Burst Changed Which Trade-Off Looked Best
A saturated system and a transient spike demand different backpressure choices. For the burst, the high-rate segment ended after 180 milliseconds, leaving time for the producer to catch up while the offered rate returned to a lower baseline. The queue first reached its 32-item limit around 582–583 milliseconds in the recorded W4 repetition. Reject and shed last touched full depth near the end of the peak, while block’s serial producer continued encountering a full queue considerably later.
| W4 burst | In-window median completed/s | Median queue-wait p95 | Median completed-job e2e p95 | Completed of 1,311 submitted |
|---|---|---|---|---|
| Block / Q32 | 257.50 | 104.15 ms | 123.04 ms | 1,311 |
| Reject / Q32 | 184.38 | 98.11 ms | 110.78 ms | 892 |
| Shed / Q32 | 184.38 | 75.86 ms | 89.58 ms | 892 |
| Block / Q128 | 258.12 | 399.89 ms | 414.38 ms | 1,311 |
| Reject / Q128 | 244.38 | 388.41 ms | 400.40 ms | 1,180 |
| Shed / Q128 | 244.38 | 360.78 ms | 373.40 ms | 1,179 |
The burst backpressure result prevents a universal recommendation. At Q32, blocking completed more jobs during the fixed window and preserved all finite submissions after drain, but its completed-job p95 was higher than the other two policies. Reject and shed produced lower completed-job latency measurements partly because they processed fewer jobs and made different admission decisions. When I judge backpressure, I cannot reward a shorter latency tail without putting the completed/removed counts next to it.
The Finite Catch-Up Effect
Because the burst subsided, the block producer eventually caught up to the scheduled stream before the offered window ended. It still needed a final worker drain. That is fundamentally different from a producer faced with hours of arrival demand beyond service capacity. The experiment used one sequential producer and a finite, precomputed schedule, so I would not extrapolate the catch-up behavior to a distributed fleet of independent clients. A burst-tolerant backpressure design also needs to decide which late jobs have expired by the time capacity returns.
The Q128 burst results underline the backpressure choice. Rejection preserved an additional 288 completions across three runs at Q128 relative to Q32, but p95 wait climbed from 98.11 to 388.41 milliseconds. Buffering made a higher completion count possible in this specific burst while exposing surviving work to a longer wait. Depending on the task’s useful lifetime, that may be desirable or wasteful.
Adding Workers Helped, Until the Test Ran Out of Demand
The backpressure study also tested one, four, and eight workers with the same four-worker-calibrated overload schedule, keeping queue capacity at 32. This is a comparison of worker counts under fixed offered work, not a search for the absolute saturation point of every configuration.
| Workers | Block window completed/s | Reject window completed/s | Shed window completed/s |
|---|---|---|---|
| 1 | 76.25 | 81.88 | 81.25 |
| 4 | 318.75 | 325.00 | 324.38 |
| 8 | 523.12 | 523.12 | 523.12 |
Increasing the worker pool from one to four materially increased measured completion throughput. At eight workers, all policies completed the complete 844-job finite schedule in each run, and the job generator became the relevant limit. The eight-worker pilot had already measured a higher short-window ceiling than the main schedule offered. I therefore cannot use 523.12 jobs/s to declare an eight-worker capacity maximum, or to claim that scaling stopped helping.
Under one worker and Q32, block took approximately 11.04–11.49 seconds to drain each overload run completely. Reject and shed each removed roughly 81% of the offered jobs under that severe mismatch. These backpressure outcomes are not evidence that a single worker was inefficiently coded; they show the effect of exposing a low-capacity worker pool to a schedule calibrated for four workers.
The larger engineering principle is to measure both the offered rate and the achieved service rate. Increasing concurrency may temporarily reduce the need for backpressure, but only until another bottleneck appears. With actual databases, networks, or rate-limited APIs, more concurrent workers can also increase contention and error rates. The present synthetic timer workload did not test those dependencies.
Retry Pressure: A Separate Workload Multiplier
Retries complicate backpressure because they are not free repetitions of the admission decision. In this lab, a worker retained ownership of its job while waiting through backoff and subsequent processing attempts. Fault injection was confined to a specified interval of an otherwise near-capacity schedule. Some failures were transient first-attempt faults; others were persistent and exhausted the three-attempt limit. The retry-enabled cases used the same planned inputs and service-time draws as their paired no-fault controls.
Across the fault-injected W4/Q32 cases, each policy received 1,428 submissions over three repetitions. All 182 terminal processing failures in the full main experiment came from these exhausted persistent injections. No main attempt reached the 80-millisecond timeout. Timeout handling did run through a separate automated test.
| Retry case, W4/Q32 | Jobs retried | Extra attempts started | Terminal failures | Rejected | Shed | Median p95 queue wait |
|---|---|---|---|---|---|---|
| Block | 247 | 320 | 73 | 0 | 0 | 218.57 ms |
| Reject | 176 | 233 | 57 | 260 | 0 | 199.11 ms |
| Shed | 166 | 218 | 52 | 0 | 232 | 106.63 ms |
The same near-capacity pattern without injected faults had no full-queue pressure and queue-wait p95 values under two milliseconds in every repetition. Under the combined fault, retry, and backoff conditions, the queue-wait tail rose sharply. That is direct evidence that the tested failure workload interfered with service. It is not an isolated estimate of how much the retries alone cost. There was no matched fault-enabled, retry-disabled experiment.
Why the Retry Denominator Matters
An especially revealing backpressure-accounting number came from shedding. For its retry cases, median started attempts per accepted job was 0.99, which might seem to suggest almost no additional work. But accepted includes jobs discarded from the queue before any worker attempted them. Restrict the denominator to logical jobs that actually reached processing, and the median became 1.18 started attempts. This is not a rounding accident. It is a change in the population being counted.
The same denominator trap exists when reporting reliability. A rejected item was never accepted. An accepted-but-shed item was not terminally processed. A persistent failure exhausted its attempts and entered the logical dead-letter record. Combining these into a generic “failed jobs” percentage erases the policy’s actual obligations. Backpressure telemetry should preserve the categories separately, so an operator can see whether work is being refused, forgotten, or genuinely failing during execution.
Backoff Is Necessary, but Not Sufficient
The backpressure lab used finite retry attempts and bounded backoff delays. That shows the mechanics of a small worker pool, not a production-safe retry controller. As described in the AWS Builder’s Library discussion of timeouts, retries, and jitter, retries during overload can amplify congestion rather than resolve it. Google’s SRE discussion of cascading failures similarly treats retries, overload detection, and load shedding as coordinated engineering decisions.
For durable side-effecting jobs, retry semantics also depend on idempotency and recovery. A timeout does not prove that a remote side effect did not happen. The SD-09 prototype had no actual database commit, external API call, outbox, or crash-safe deduplication mechanism. I would not advertise exactly-once delivery, durable retry, or business-transaction safety on the strength of these results. Here, backpressure was observable and bounded in memory; durability was outside the study.
The Accounting Identity I Would Put on Every Pipeline Dashboard
To interpret backpressure around a queue, I start with work reconciliation rather than a single latency graph. The study’s lifecycle model required exactly one admission outcome and exactly one terminal outcome per actual submission. For the recorded main runs, the following identity closed:
Submitted = accepted + rejected.
Accepted = completed + terminally failed + shed + cancelled.
The aggregate numbers were 49,356 submitted, 45,063 accepted, and 4,293 rejected. Within accepted work, 40,618 completed, 182 failed terminally, 4,263 were shed, and none were cancelled. Both equations reconcile exactly. These totals are useful as an audit of the recording process, but because they combine many different configurations, they are not an all-purpose performance score.
Count the Planned Work That Has Not Yet Reached Admission
The backpressure system additionally records a planned schedule and actual submission times. That allows it to distinguish “not submitted yet” from “rejected.” In a real system, this distinction might correspond to blocked HTTP clients, upstream buffering, producer backlogs, or work awaiting a broker publish. A bounded internal FIFO does not constrain those areas without an end-to-end policy.
For blocking-based backpressure, I would monitor capacity-wait episodes, total producer delay, and the gap between planned and actual demand. For explicit rejection, I would monitor the rejected fraction and how callers handle refusals. For shedding, I would monitor the identities and business value of items removed after admission. These are different backpressure stories, even when the queue-depth chart reaches an identical maximum.
What a Queue Depth Chart Cannot Tell Me
A graph capped at 32 proves only that the implementation did not leave more than 32 items waiting in that queue. It does not reveal whether the producer is falling behind, whether accepted work later disappears, or whether worker-owned jobs are stuck in backoff. Under the measured overload, the block queue was full for about 88% of the window, versus approximately 50–53% under rejection and shedding. Yet the same maximum depth appeared in all three cases.
To evaluate backpressure, I would pair the depth trace with an admission-outcome histogram and a clock decomposition. A technically correct bounded queue is necessary for controlled overload, but backpressure cannot be declared successful from maximum occupancy alone.
The Engineering Decision Matrix
| Work contract | Safer initial policy direction | Requirement that cannot be skipped |
|---|---|---|
| Durable financial or order action | Explicit bounded admission with durable recovery, or safely blocked upstream flow | Idempotency, durable handoff, retry coordination, and explicit failure handling |
| Optional live preview or replaceable snapshot | Consider superseding stale queued work | Proof that newer work makes earlier work unnecessary |
| Background export with a caller awaiting acceptance | Explicit rejection or bounded producer wait, depending on caller deadlines | Honest response about whether the job was accepted and will be processed |
| Interactive work with strict latency objectives | Conservative queue limit and fast overload response | Monitor rejected demand and actual end-to-end completion deadlines |
| Batch work with finite, flexible deadlines | Bounded blocking and planned drain capacity may fit | Upstream queue bounds and reliable shutdown/recovery |
This backpressure matrix is a professional decision framework, not an experiment on real orders, exports, or live previews. The right policy also depends on client-facing contracts, retry budgets, request expiry, priority classes, and the cost of a job’s side effects. For many applications, policy must operate at more than one point: before admission, inside a worker, and during external dependency calls.
What I would not do: I would not choose drop-oldest simply because its queue-wait p95 was the smallest in this experiment. I would not choose blocking simply because it eventually completed every finite submission. I would not choose rejection simply because it gave an immediate terminal admission result. I would first specify which work may wait, which work may be lost, and what the caller has been promised. That is where an operational backpressure strategy becomes a product and reliability decision.
Before and After: The Difference Is in What We Measure
The useful change from a naive backpressure benchmark to this audit is methodological, not a claim that a real service was improved. In a throughput-only assessment, rejection and shedding look competitive because their in-window completion rates were slightly higher than blocking. In a completion-only latency assessment, shedding looks especially responsive. Neither view accounts for all the work offered to the system.
After the backpressure accounting and clock decomposition, the interpretation changes: blocking transferred delay to the producer and to the drain; rejection refused work before a processing promise; shedding discarded some work after accepting it. The output measured at a worker is only one slice of the service contract. For me, the most useful backpressure measurement is a complete lineage from offered demand through admission to an explicit terminal outcome.
Evidence Quality, Reproducibility, and What Passed
The backpressure evidence package contains the working Python pipeline, frozen experiment specification, per-run manifest, lifecycle streams, metric CSVs, chart inputs, test logs, source log, hypothesis register, and a verification script. The original runs were executed in a macOS arm64 environment on CPython 3.14.8. The 81 main runs and six pilots are recorded separately. The verifying tool reconstructs state transitions and timing samples from raw events instead of importing the original pipeline’s analysis functions.
The backpressure package’s independently replayed checks cover queue capacity, one terminal status per submission, worker ownership, FIFO rules, retry ordering, actual timestamp boundaries, and count reconciliation. It also checks that plotted data correspond to recorded runs. A deliberate corrupted-metric negative control was caught in a disposable copy, while the original evidence remained unchanged. The package provides useful reproducibility, but reproducibility here means being able to inspect the frozen method and rerun it with the available environment—not expecting the event-loop scheduler to reproduce identical nanosecond timings on every machine.
Evidence and Methodology Notes
| Evidence level | What I can safely say | What I cannot say |
|---|---|---|
| Executed main runs | Three policies were measured across a 27-cell frozen matrix with three repetitions | The results predict production throughput or SLO compliance |
| Raw event replay | Recorded counts, queue-depth transitions, and percentiles reconcile | The software can never fail under an untested condition |
| Automated correctness tests | The specific tested cancellation, retry, drain, and bookkeeping paths passed | The system offers crash-proof or exactly-once delivery |
| Official Python documentation | Queue and task APIs have the documented semantics | Every application built on them has safe overload behavior |
| SRE engineering literature | Retry budgets and controlled overload are established design concerns | This specific synthetic test proves a cloud system’s behavior |
A copy of the research archive should remain with the editorial record even if the article only publishes selected tables and graphics. Claims in the article are bound to the measured configurations, not to the aesthetic certainty of a clean chart.
Limitations That Change the Decision
The most consequential backpressure study constraint is duration. The central measurement window was 1.6 seconds, followed by drain. Three fresh processes per configuration provide three observed results and a range, not long-run statistical confidence. They do not show whether a service stays within memory and latency objectives after a day of bursty demand.
Second, the worker operation was a synthetic asynchronous timer. No database, external HTTP dependency, disk workload, distributed broker, or network partition was exercised. The optional CPU-bound mode was only smoke-tested for correctness. The high-water process RSS values, approximately 36.56–39.06 MiB, included interpreter state, workload data, and in-memory telemetry; they cannot be used to infer how much memory the FIFO alone consumed. There was no unbounded-queue comparison or isolated retry-disabled fault control.
Third, the offered schedule came from a single producer with predetermined arrivals. Blocking slowed actual submissions. A production client population may generate outstanding requests independently, and another layer would need to bound those requests. The observed absence of hidden job loss means this in-process event ledger closed; it does not establish durable recovery after process termination. The backpressure results have strong internal accounting for a narrow lab, not external validation of end-to-end delivery.
Fourth, worker scaling at eight became demand-limited under the fixed four-worker-based workload. I can report increased throughput up to that point, but I cannot identify the eight-worker saturation boundary. The throughput differences between policies were small and in some cases their observed ranges touched. They do not justify a universal winner.
Finally, the p95 figures describe selectively observed populations: work that entered the queue and reached a worker, or work that completed successfully. Exclusions are part of the outcome, not statistical noise. Any summary that hides the rejected and shed counts would reverse one of the study’s central lessons.
What I Would Test Next Before a Production Decision
For a more operational backpressure evaluation, I would run longer windows with repeated bursts and recovery periods, instrument a real dependency with controlled limits, and measure actual upstream outstanding work. I would also compare an unbounded backlog as a deliberately constrained baseline, add concurrent producers, and separate injected failures with retries enabled from the same failures with retries disabled.
A production backpressure design would additionally need explicit job expiry, cancellation, idempotency keys, durable state transitions, replay after crashes, dead-letter retention policy, and alert thresholds tied to customer-visible outcomes. Work that is allowed to be evicted should carry a supersession rule rather than relying solely on age. I would test what happens when the cancellation arrives while a producer is blocked, and when a retry fires after the originating client has abandoned its request.
None of these future tests is quietly assumed to have occurred. They are the next evidence needed to extend a short, instrumented backpressure study toward a real reliability decision.
Key Terms and Interpretation Guide
- Backpressure: A way of making offered demand confront a downstream capacity limit through waiting, refusal, or a deliberate admission policy.
- Bounded queue: A FIFO with a positive limit on the number of jobs waiting inside it; running work and upstream demand require separate accounting.
- Producer schedule lag: Delay between when the test intended to offer a job and when the producer actually submitted it.
- Queue wait p95: A high-percentile waiting-time observation among jobs successfully acquired by workers, calculated using the experiment’s nearest-rank rule.
- Load shedding: Deliberate removal of work according to a documented rule, distinct from a processing failure.
- Retry amplification: Additional processing attempts incurred by retried logical jobs; its value depends on the denominator.
- Dead-letter outcome: A recorded terminal status after permitted processing attempts are exhausted; not necessarily a durable external dead-letter queue.
Quick Summary
This 81-run lab demonstrated that the same bounded FIFO can lead to very different outcomes under identical planned demand. Four-worker overload at Q32 produced similar in-window throughput under block, reject, and shed, while rejecting or discarding roughly a third of offered jobs under the latter two strategies. Blocking eventually processed the finite schedule by extending producer delay and drain. Increasing queue capacity admitted more jobs but lengthened queue waits; adding workers increased measured processing until the fixed workload no longer saturated the larger pool. Injected faults plus retries raised processing effort and queue delay, without isolating the marginal cost of retries alone.
The backpressure conclusion is not that one algorithm always wins. It is that backpressure should be evaluated with offered-work accounting, admission outcomes, queue-wait denominators, producer delay, and the real value of a job. A single rate or percentile can describe the workers accurately while describing the system’s obligations poorly.
Sources, Lab Materials, and Related Reading
The observed numerical results come from the SD-09 frozen experimental package dated November 11, 2026: SD-09_RESEARCH_REPORT.md, SD-09_CASE_SUMMARY.csv, SD-09_METRICS.csv, SD-09_RUN_MANIFEST.csv, raw lifecycle evidence, and SD-09_VERIFICATION.md. These are primary experimental records, not externally published benchmarks. The following references are documentation and contextual engineering guidance rather than sources of the measured figures:
- Python documentation: asyncio queues, for FIFO capacity and
put()/put_nowait()semantics. - Python documentation: coroutines and TaskGroup, for structured task lifetime and cooperative cancellation.
- Python documentation: monotonic performance timing, for the event clock’s API semantics.
- Google SRE: Addressing Cascading Failures, for the broader overload and retry-risk framework.
- Google SRE: Handling Overload, for service-level admission and overload policy context.
- AWS Builder’s Library: Timeouts, retries, and backoff with jitter, for retry amplification and coordinated recovery considerations.
For more research-led software engineering articles, see the Software Development category and the Articles archive. These links are editorial navigation; their current HTTP responses were not established in the research execution environment.
Author’s Note
I regard this as a useful laboratory-level argument for designing explicit overload behavior, not a license to advertise “exactly once,” guaranteed throughput, or universally safe load shedding. Preserving the unsuccessful or excluded work in the story is more important than making a dashboard look fast. If the queue stays bounded while obligations disappear silently, the system’s most important failure may be missing from the graph.