


Creative Pipeline: Quality Beyond Folder Structure

If you only read one thing: Marketing attribution assigns credit under a measurement model. It does not, by itself, establish that an advertisement caused a sale, that the sale created profit, or that the customer would otherwise have been lost. A dashboard can be internally consistent and still answer the wrong financial question.
A Convincing Dashboard Can Answer the Wrong Question
Marketing attribution can be internally coherent while missing important financial outcomes. A marketing dashboard can show a high return on ad spend, a positive trend in reported conversions, and a campaign identified as the strongest contributor. Yet the business may see flat contribution margin, a high share of existing customers, or sales that would have happened without the campaign. There is no necessary contradiction. The dashboard may be accurately calculating attributed outcomes while leadership is asking about incremental business outcomes.
I approach marketing attribution as a decision model rather than an immutable record of causality. Attribution answers a conditional question: given particular touchpoints, tracking rules, identity signals, windows, and modeling assumptions, where does the system allocate credit? Financial performance asks different questions: what revenue and contribution were realized, what costs were incurred, how many new customers were added, and what would have happened in the campaign’s absence?
Those questions should be connected, but never collapsed into one metric. This article does not use real client advertising data. The numbers below are labeled illustrative calculations, and the proposed review framework is conceptual rather than a validated lift or profitability measurement system.
What a Marketing Attribution Model Actually Does
A touchpoint is not a causal explanation
Marketing attribution assigns credit for a key event, conversion, or transaction to interactions along a journey. The journey can include paid clicks, search, direct visits, email, creator content, and other interactions, but only to the extent those interactions are observed or modeled within the measurement system. The attributed path is not necessarily the complete customer journey.
Google Analytics 4 documentation distinguishes paid-and-organic data-driven attribution from last-click reporting models. Its attribution settings guidance explains that data-driven attribution distributes credit using available property data, while the last-click alternative assigns credit to the final eligible interaction under its rules. Changing the model changes credit allocation. It does not rewrite history to reveal an unknowable true cause.
Observation and model inference are separate lanes
A marketing attribution report should not collapse observation into inference. An observed click, an attributed key event, a modeled conversion, and an experimentally estimated incremental conversion are different objects. Each carries different assumptions and uncertainty. I want any serious marketing attribution report to label which figures are directly observed, which are modeled, which have been reconciled with transaction records, and which have causal support from a deliberate experiment.
The Four Numbers That Should Never Be Treated as Synonyms
| Measure | What it can tell us | What it cannot establish alone | Supporting evidence |
|---|---|---|---|
| Attributed conversions | Credit under specified attribution rules | Incremental demand caused by ads | Model, windows, event definitions |
| Modeled conversions | Estimated events where direct tracking is incomplete | Exact identity of every converting user | Modeling documentation and limitations |
| Incremental conversions | Estimated causal difference in a valid experiment | Profitability without cost and margin | Treatment/control design and uncertainty |
| Financial contribution | Revenue less relevant variable costs | Attribution to one touchpoint by itself | Order, refund, margin, cost records |
A campaign incrementality analysis may require a different study design from platform reporting. An advertiser can legitimately use all four, but the labels and decision rights should match what each number means. For instance, optimizing bids on modeled conversions may be operationally useful while a separate finance view determines whether total customer economics improved.
Why Last Click Is Easy to Explain and Easy to Overread
Marketing attribution can use a last-click convention. Last-click attribution offers a simple story: the final eligible interaction receives the credit. That simplicity can be operationally useful when teams need a consistent reporting rule. But a person who clicked an ad just before buying may already have decided to purchase. Brand search frequently occurs near the end of a journey, and the final interaction may underrepresent the influence of earlier activity.
The opposite mistake is to assume every early touchpoint deserves credit. Exposure before a purchase does not prove influence either. A marketing attribution model allocates credit according to a rule; causal evidence requires a design that can separate campaign exposure from what would have occurred without it.
Data-Driven Attribution Is Still a Model
Marketing attribution can use model-based credit allocation. GA4 data-driven attribution uses conversion and non-conversion paths to estimate contributions for key events. Google’s attribution overview explains that the model is specific to advertiser and event data. That can be more informative than a rigid last-click rule for certain reporting uses, but there are limits to the observable paths and the behavior inferred from them.
I would never describe a data-driven percentage as a measured probability that a particular impression caused an individual purchase. Instead, I document model type, lookback window, event definitions, channel inclusion, and data availability. A change in any of those can produce a reporting discontinuity without a corresponding change in underlying demand.
Consent, Identity, and Missing Data
Marketing attribution is affected by browser restrictions, consent choices, cross-device journeys, platform boundaries, and tagging implementation. Some legitimate customer activity cannot be linked to an advertising interaction. Conversion modeling can help with aggregate estimates, but should be labeled separately from observed transactions. Filling missing paths with a model may improve aggregate decision support, but it changes what the number represents.
Google’s consent mode documentation distinguishes basic and advanced implementation behavior and the possible modeling approaches. It does not justify bypassing consent, treating a modeled outcome as observed, or assuming that implementation alone solves tracking gaps. Privacy obligations and local rules must be assessed separately.
A good report should specify which signals exist, what consent regime applies, whether modeled figures are included, and which channels have weaker visibility. It should avoid reverse-engineering individual identity from incomplete data or suggesting that data collection must expand at any cost.
ROAS Is Revenue Relative to Ad Spend, Not Profit
Marketing attribution dashboards typically calculate ROAS as attributed revenue divided by advertising spend. A 4.0x ROAS says that reported revenue is four times the ad spend under that platform’s measurement configuration. It does not say profit is four times ad spend, nor that every reported sale would disappear if advertising stopped.
Google Analytics defines return on ad spend in terms of revenue for every advertising dollar spent in its Google Ads campaign report. Google Ads separately discusses ROI as a profit-oriented measure. The distinction is not semantic; it affects whether a campaign should be scaled.
A fully illustrative profit bridge
Assume an entirely hypothetical campaign reports $10,000 in attributed revenue and $2,500 in ad cost. The reported ROAS is 4.0x. Now assume a 25% contribution margin before marketing after relevant variable costs. The reported orders contribute $2,500 before advertising, so subtracting the $2,500 ad spend leaves $0 contribution after advertising, before fixed overhead and before we have established that the orders were incremental. This example uses round fictional inputs to show a mathematical boundary, not an industry benchmark or a company’s result.
| Illustrative input | Assumed value | Calculation | Interpretation |
|---|---|---|---|
| Attributed revenue | $10,000 | Hypothetical dashboard total | Not demonstrated incremental revenue |
| Advertising cost | $2,500 | Hypothetical media expense | Excludes other costs |
| Reported ROAS | 4.0x | $10,000 / $2,500 | Revenue divided by ad spend |
| Pre-ad contribution margin | 25% | $10,000 × 0.25 | Assumed order economics |
| Contribution before ads | $2,500 | $10,000 × 0.25 | Before advertising cost |
| Contribution after ads | $0 | $2,500 − $2,500 | Before fixed costs and causal adjustment |
If a marketing attribution dashboard showed this 4.0x result, the next question would be whether the orders were incremental, how refunds and returns are treated, and whether customer economics improve over time. Presenting the illustrative contribution as actual campaign profit would be a serious error.
Customer Retention Changes the Economics
Marketing attribution must be interpreted in the context of customer value. A first purchase and a repeat purchase should not automatically carry the same acquisition objective. The business may accept lower initial contribution when defensible retention evidence supports later value. But projected customer lifetime value depends on assumptions about repeat purchase, churn, margins, discounting, and the period over which the customer is measured.
A marketing attribution dashboard can help locate activity, but cohort analysis and finance data are needed to understand durable customer outcomes. If lifetime value is projected, label it a model. If a campaign mostly reaches existing customers, distinguish customer reactivation from acquisition; both can have value but should not be reported interchangeably.
Incrementality Asks a Different Question
Marketing attribution and incrementality answer different questions. Incrementality asks: what additional outcomes occurred because of advertising, compared with a credible counterfactual? Randomized experiments or carefully designed geo tests can help answer that question when feasible. A lift estimate is not available merely because a marketing attribution platform shows an attribution pathway.
Google Ads explicitly distinguishes standard attributed conversions from incremental conversions calculated with treatment and control groups in its Conversion Lift methodology. The incremental difference is an estimate tied to study design and uncertainty; it is not a universal adjustment factor to apply indiscriminately to all campaigns.
A hypothetical lift example
Imagine a properly designed study in which comparable treatment and control groups are exposed to different advertising conditions. If an appropriately normalized treatment group has 110 conversions and its control equivalent has 100, the illustrative lift is 10 conversions. Whether that result is statistically distinguishable from noise depends on actual sample size, allocation, variance, contamination, and analysis. I am not claiming that ten conversions would be significant. The arithmetic is purely explanatory.
For many independent professionals and small businesses, a rigorous lift experiment may be too expensive or underpowered. In that case, report the limitation. Use cautious triangulation of customer and financial evidence rather than inventing a causal result from a dashboard.
Why Two Platforms Can Claim the Same Sale
Marketing attribution results from two platforms can overlap. Two ad networks may each report credit for a transaction under their own windows and exposure definitions. Their totals can overlap. Different identities, modeled conversions, view-through rules, and reporting delays can create legitimate discrepancies. A sum of platform-attributed revenues should therefore not automatically be treated as reconciled business revenue.
I would create a reconciliation table with three separate views: platform-reported outcomes, cross-channel analytics outcomes, and finance-confirmed orders. The aim is to reveal differences in definitions and visibility. In marketing attribution, a discrepancy is a research question, not proof that one vendor is fraudulent or that the business’s accounting is wrong.
What a Finance Reconciliation Can Actually Establish
Marketing attribution does not replace finance reconciliation. Finance systems can validate realized orders, refunds, discounts, unit economics, and payment status, subject to the quality of the source records. They do not automatically assign causality to an advertising impression. Conversely, campaign platforms can help identify which creative or audience segments appear responsive, but their reported revenue may differ from recognized financial revenue.
Revenue reconciliation should respect privacy and data quality. The join between those systems should use privacy-preserving, appropriately authorized identifiers and clear event definitions. If that reconciliation is not permitted or technically viable, report aggregate differences and limitations rather than forcing a false exact match.
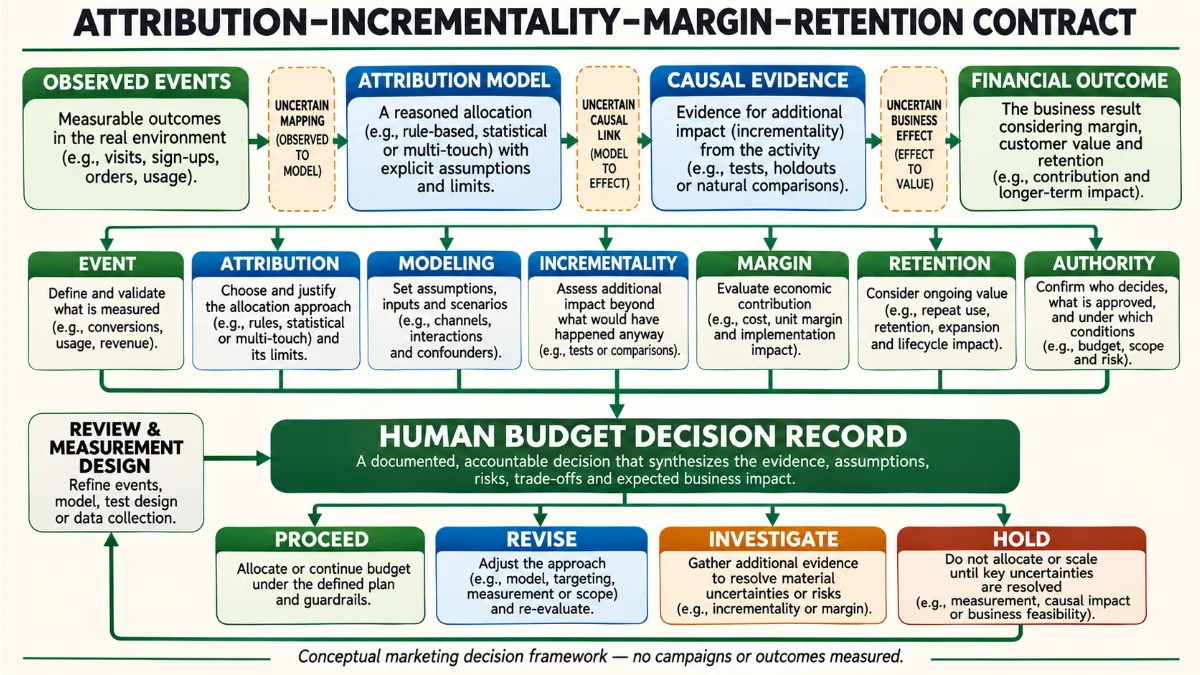
The Attribution–Incrementality–Margin–Retention Contract
I use this conceptual contract to prevent one measurement lane from making claims that belong to another. It is an operational review tool, not a proprietary statistical estimator.
| Domain | Question | Evidence to retain | Unacceptable shortcut |
|---|---|---|---|
| EVENT | What counted as a conversion? | Instrumentation definition, deduplication | Treat every lead as a sale |
| ATTRIBUTION | How was credit assigned? | Model, channels, windows | Claim attribution proves causality |
| MODELING | Which outcomes were inferred? | Method scope and data limitations | Present modeled as directly observed |
| INCREMENTALITY | What is the counterfactual? | Study design and uncertainty | Declare lift from a ROAS number |
| MARGIN | Did orders contribute economically? | Returns, cost of goods, media cost | Substitute revenue for profit |
| RETENTION | What happened beyond acquisition? | Cohorts and measured repeat outcomes | Assume projected LTV is realized |
| AUTHORITY | Who can change spend? | Decision owner, thresholds, review | Automatic scale-up from one metric |
The contract is valuable because marketing attribution can remain useful for tactical decisions without being promoted into the final source of truth for causality or profitability. A decision to increase spend should be connected to financial outcomes and uncertainty, not merely to a visually attractive column in one tool.
Three Hypothetical Dashboard Conflicts
Scenario A: high ROAS, weak contribution
Hypothetical. A campaign has impressive attributed revenue but high discounts, shipping expense, and returns. The margin bridge shows little money left after advertising. The appropriate response may be to review product mix and cost structure rather than optimize the ad copy alone.
Scenario B: two networks, one order
Hypothetical. A customer sees a video ad on one network, clicks search on another, and purchases. Both platforms report credit under their own rules. Reconciliation must avoid adding both numbers as if they represent two separate orders.
Scenario C: strong short-term volume, weak retention
Hypothetical. A promotion generates new first purchases with an apparently acceptable cost per acquisition, but the cohort later shows poor repeat economics. A short reporting window may have rewarded volume without capturing the longer-term consequence. This is a design problem for the decision process, not proof that all short-term campaigns are ineffective.
A Measurement Plan Before the Next Campaign
To use marketing attribution responsibly, start with a decision: what would you change if the evidence were favorable or unfavorable? Define the exact event, revenue scope, relevant margin, and reporting window. Document attribution settings, identity and consent limitations, and whether the dashboard is showing observed or modeled figures. Agree with finance on the reconciliation cadence and sources of truth.
Where the budget and audience support it, design an incrementality experiment before launching or changing spend. Otherwise distinguish association from causation in the report. Choose a review owner who can recommend a budget change and a separate authorization boundary for material spending commitments.
Practical Controls for Small Teams
Marketing attribution need not be computationally elaborate to be useful. A small team does not need a complex multi-touch attribution vendor to become more honest. It can begin with a one-page metric dictionary, stable event definitions, documented UTM practices, periodic transaction checks, and a margin-aware acquisition view. If privacy constraints prevent granular measurement, a clear aggregate report with named blind spots may be better than an elaborate but unreliable person-level reconstruction.
For expensive or consequential campaigns, I would add a test plan, predeclared decision criteria, and stop conditions. The objective is qualified, profitable, durable demand. A rising count of platform conversions is only one possible indicator.
Where Attribution Models Are Still Useful
Marketing attribution is not worthless. A well-understood model can help compare campaign operations under consistent definitions, reveal changes in customer pathways, and identify creative or channel combinations worth testing. It is often cheaper and faster than running a new experiment for every tactical question.
The problem begins when model-dependent credit is described as certain causal impact. Good governance keeps the model useful within its domain and escalates to experimental or financial evidence when the decision demands it.
The Attribution Window Is a Business Assumption
A marketing attribution report often uses a lookback window defining how far before the conversion eligible interactions can receive credit. Changing the window can move credit among campaigns or reduce the reported conversions without changing the underlying transaction count. Long purchase consideration cycles and short impulse purchases may need different interpretive cautions. The right window cannot be inferred solely from the industry label.
I would record the conversion window next to every material performance comparison. A chart covering six months may look consistent while an attribution setting was changed in the middle. Before declaring a channel improvement, inspect configuration history, tagging deployment dates, reporting delays, and the effect of modeled data. If the system cannot reproduce a historical report under the same rules, that limitation belongs in the decision memo.
New Customer Revenue and Retargeting Revenue Are Different Decisions
Marketing attribution may credit a campaign for the purchase of a customer who was already likely to buy. That does not mean retargeting is inherently wasteful: reminders, education, and reactivation can provide real value. The important distinction is between acquisition, retention, and demand capture, with appropriate financial goals for each.
A company can test whether retargeting delivers incremental revenue, but it should avoid declaring every purchase in an exposed audience newly caused. For acquisition, I want customer status and first-order economics. For retention, I want a defensible counterfactual, contribution over the relevant window, and a clear definition of inactive versus existing customers. The categories should be defined before campaign results are interpreted, not chosen afterward to make a report more attractive.
A Decision Ledger Can Prevent Metric Gaming
Good marketing attribution governance records the budget decision, decision owner, available evidence, unresolved uncertainty, and the review trigger. When a campaign reports a sharp increase in modeled conversions but finance-confirmed orders remain flat, that divergence should lead to investigation before automatic scale-up. When an experiment finds positive incremental impact, the team still needs to check whether the incremental orders contribute enough margin to support expansion.
I would not assign a single red-amber-green score that hides those trade-offs. Instead, the report should state which findings are observations, which are model estimates, which are causal inferences, and what action is authorized. That forces the financial question into the same conversation as the marketing optimization question without confusing their scopes.
Evidence and Methodology
The technical descriptions are grounded in GA4 attribution model settings, GA4 attribution reporting, consent mode behavior, Google Ads Conversion Lift, and Analytics ROAS definitions. The contract and examples are original editorial models, not validated causal studies. Exact settings and vendor terminology can change; confirm them in the live account before applying recommendations.
Related Reading
For the earlier step of choosing events and decision questions before configuring analytics, see GA4 Measurement Plan: Decisions Before Dashboards. Here the narrower issue is why attribution credit should not stand in for incremental financial evidence.
Frequently Asked Questions
Does a 4.0x ROAS mean four dollars of profit per ad dollar?
No. It describes attributed revenue divided by ad spend under the reporting model. Margin, operating costs, returns, and incrementality still matter.
Is data-driven attribution causal measurement?
Not equivalent to a randomized experiment. It assigns credit using model assumptions and available interaction data. It can support decisions but does not settle the counterfactual by itself.
Can two platforms report the same purchase?
Yes, depending on reporting rules and attribution windows. Do not simply sum cross-platform attributed revenue as distinct finance-confirmed orders.
Do modeled conversions mean fraudulent data?
No. Modeling can estimate outcomes when direct observation is incomplete. The report should disclose that distinction and the relevant limitations.
What does incrementality measure?
The estimated difference between outcomes under exposure and a credible comparison condition, within the scope and uncertainty of a particular study.
Is last-click attribution always wrong?
No. It can be a consistent operational convention. The mistake is treating that convention as a full account of causal influence.
Should a small business run a lift test for every campaign?
Not necessarily. Tests can be costly or underpowered. Focus experiments where decisions are material, and disclose uncertainty when causal evidence is unavailable.
Which number should leadership review first?
Start from the decision and its financial objective, then inspect reconciled outcomes, contribution margins, retention, measurement limitations, and attributed channel signals together.
Key Terms
Marketing attribution: model-dependent allocation of conversion credit. ROAS: attributed revenue relative to ad spend. Incrementality: causal difference attributable to an intervention under a defined study. Contribution margin: revenue remaining after specified variable costs. Modeled conversion: an estimated outcome derived from incomplete direct signals. Counterfactual: what would have occurred without the intervention.
Author’s Note
I want marketing reports that help someone make a defensible decision, not reports that merely look certain. If a dashboard cannot explain what was observed, what was modeled, and what was actually earned, I consider the model incomplete for financial decision-making. Marketing attribution should inform the conversation with finance, not end it.