


Measuring Usability Beyond Conversion Rates

3D Environment Design: Exploration Meets Performance

Decision Brief: Diagnose the Constraint Before Adding Resources
When a virtual machine becomes slow, assigning more virtual CPUs or more memory can feel like an obvious remedy. I consider that a hypothesis, not a diagnosis. Virtualization performance depends on how a particular workload crosses several resource boundaries: physical processing capacity, the hypervisor’s scheduling decisions, host and guest memory behavior, virtual storage, and the graphics path that the application actually uses. A delay that looks like a slow processor might begin with a disk queue or memory paging, while a perfectly responsive desktop can conceal a GPU limitation that appears only when an application requests acceleration.
My starting question is not how many resources the guest has been assigned. It is which layer delays the useful task, what observation would confirm that explanation, and what change can test it without destroying comparability? A configuration that boots, renders a desktop, and launches a few tools has passed a useful compatibility threshold. It has not automatically passed a performance test for a compiler, database, design application, or graphics-intensive workload.
This article develops a Virtual Resource Bottleneck Matrix to connect symptoms, measurements, possible causes, and reversible interventions. It is an engineering decision framework derived from documented virtualization mechanisms, not a new benchmark study. All resource-allocation examples are illustrative. I do not report performance gains, latency figures, or GPU results that were never measured.
Why Virtualization Performance Is a System Property
A guest operating system sees a virtual machine: virtual CPUs, a quantity of memory, a virtual disk controller, virtual networking, and often a display adapter. The host operating system and hypervisor must map that logical configuration to real scheduling time, physical memory, storage operations, and available device capabilities. An application running inside the guest sees yet another layer. Its requests may pass through a native architecture, a compatibility layer, or a software renderer before the underlying hardware performs useful work.
The important implication is that a guest-level utilization percentage cannot describe the full path. A guest might show low CPU utilization while its storage requests wait. A host might show substantial memory pressure while a guest still reports available RAM. A virtual GPU may be present even when the application uses software rendering. To evaluate virtualization performance responsibly, I separate capacity (what has been allocated), contention (what is competing for it), capability (what is supported), and observed task outcome (what the user actually completed).
Hypervisors Do Not Expose the Same Counters
Enterprise hypervisors, desktop virtualizers, and operating-system virtualization frameworks can expose different diagnostic signals. VMware ESXi, for example, exposes CPU-ready and other scheduling information that helps distinguish guest processing demand from time waiting for physical CPU resources. Those ESXi metrics should not be pasted unchanged into a VMware Fusion troubleshooting recipe; Fusion on macOS does not promise the same interface or counters. Broadcom’s ESXi performance troubleshooting guidance treats CPU, memory, storage, and network as separate possible bottlenecks, which is the transferable principle.
Similarly, a Windows guest and a Linux guest can report different memory, CPU, and I/O indicators. I choose measurements that exist on the actual host, guest, and hypervisor instead of building a universal dashboard out of counter names that may not exist on the chosen platform. The work is transferable; the instrumentation needs to be platform-specific.
CPU Scheduling: More vCPUs Can Mean More Contention
Virtual CPUs are scheduling resources, not a guarantee of dedicated physical cores. A guest configured with six vCPUs may run multiple threads concurrently when host capacity and scheduling permit, but the displayed number does not establish that six physical cores are exclusively reserved for it. Hypervisors must also schedule device emulation, interrupts, host processes, and other guests. Virtualization performance can suffer if the workload needs execution time that the host cannot provide predictably.
Separate CPU Demand From CPU Waiting
High guest CPU usage during compilation, compression, indexing, or an intentionally compute-heavy task can indicate productive utilization rather than a malfunction. I would first inspect completed work per unit of time and the workload’s thread behavior. A serial task may not gain much from additional vCPUs; a parallel build might benefit until synchronization, memory bandwidth, storage, or host contention becomes dominant. Low CPU activity in a slow guest presents a different virtualization performance question: what is the task waiting for?
On a platform that exposes ready time or equivalent scheduler contention, sustained waiting can help identify unavailable host execution capacity. On other desktop platforms, I would correlate host CPU activity, guest thread demand, other host processes, and repeatable changes in task duration. The Microsoft Hyper-V performance troubleshooting guidance begins with host resource availability and virtual machine configuration rather than treating an individual guest percentage as definitive evidence.
Why Oversizing a Guest Is Not a Free Upgrade
Giving a guest more vCPUs increases the execution capacity available to the guest when its workload can use that parallelism and the host can supply it. It can also create unnecessary scheduling demand and leave less headroom for the host or additional guests. The exact effect depends on the hypervisor scheduler, workload, core topology, thermal behavior, and any host-level resource constraints. I would not claim that increasing vCPUs always hurts or always helps virtualization performance; both statements ignore the conditions that determine the outcome.
A useful controlled experiment keeps the workload and software configuration fixed, then compares a small number of permitted vCPU allocations across repeated runs. I would observe task duration, guest CPU activity, host activity, and any scheduling counters that are actually available. A result is meaningful only if the input, output validity, background activity, power mode, and repeat conditions are documented. If the guest becomes faster but the host becomes unusable, the improvement has an operational cost that belongs in the decision.
Native ARM Execution Is Not x64 Application Emulation
On Apple Silicon, a supported ARM64 guest is virtualized on ARM hardware; this is distinct from translating x64 application instructions inside that guest. Broadcom’s Apple Silicon Fusion compatibility guidance describes the ARM64 guest-architecture requirement, while Microsoft’s Windows on Arm documentation explains how x86 and x64 user-mode applications are emulated. A slow x64 application inside an ARM guest therefore cannot automatically be blamed on virtualization overhead alone. Translation, application dependencies, thread behavior, and native software availability are additional variables.
I would record whether the tested binary is native ARM64, x64 under emulation, or an application with mixed components. The result of one mode is not a controlled comparison of the other modes. Kernel-mode drivers are a separate compatibility concern: Microsoft states that x86/x64 kernel drivers are not emulated by Windows on Arm. That is a capability boundary, not just a performance setting.
Host Memory Pressure: The Resource a Guest Cannot See Clearly
A guest may display an appealing allocation such as 8, 12, or 16 GB and still perform poorly if the host is under pressure. Guest-visible RAM is only one part of the picture. The host must also accommodate its operating system, the virtualization process, graphics and I/O buffers, filesystem caches, other applications, and any concurrently active virtual machines. When those competing demands exceed the useful physical-memory budget, the system may compress memory, reclaim caches, page data, or use swap. The exact mechanism differs across operating systems and hypervisors.
Why Free Memory Is the Wrong Single Metric
On macOS, Apple’s Activity Monitor guidance explains that memory pressure combines information including free memory, swap, wired memory, and cached files. Looking only at an apparently small free-memory number can be misleading because unused memory may be serving as a useful cache. More informative signals include the pressure trend, active swapping, compression activity, and whether the slowdown coincides with another large host workload.
Inside Linux guests, the kernel’s Pressure Stall Information reports CPU, memory, and I/O stall pressure under /proc/pressure/ on supported systems. It helps distinguish a resource that is busy from work that is actually stalled. PSI is a Linux mechanism and cannot be assumed available in every Windows guest or host. In either operating system, a single instantaneous number is weaker evidence than a time-correlated sequence captured while the problem occurs.
Allocation Is a Budget Decision, Not a Score
I would allocate enough guest memory for the workload’s verified working set, then preserve enough host headroom for normal tasks and bursts. Too little guest memory may force guest paging. Too much allocation may amplify host contention, depending on whether memory is reserved, dynamically managed, or reclaimed by the virtualization product. The correct decision is constrained by both host and guest behavior. I prefer describing this as a shared capacity budget rather than seeking a universally optimal fraction of installed RAM.
For example, imagine a host simultaneously running an editor, a browser, and a virtual machine that performs a build. The guest might request more RAM because its build is paging, but increasing the guest allocation could make the host browser and editor sluggish if overall memory pressure rises. Conversely, reducing guest RAM could eliminate host pressure while creating guest-level faults. The controlled test is to observe both sides and move only one allocation variable at a time. No numeric improvement is implied by this hypothetical example.
Memory and Storage Can Create a Feedback Loop
Memory scarcity often becomes visible as storage activity. Guest paging generates virtual disk requests; host swap creates host storage operations; both can contend with the workload’s normal reads and writes. A developer may see a slow database, delayed build step, or unresponsive desktop and assume the disk is inherently too slow, when the underlying cause is a memory deficit. The reverse is also possible: normal disk-bound behavior can occur without any significant memory pressure. Virtualization performance troubleshooting therefore needs the timeline of both memory pressure and I/O latency.
Storage I/O: Throughput Is Not the Same as Latency
A virtual disk presents a convenient abstraction, but reads and writes still travel through guest filesystems, virtual storage controllers, the hypervisor, host filesystems, and physical or networked media. Each layer can add queuing, caching, translation, and failure modes. A high advertised SSD transfer rate does not demonstrate that a VM will receive low latency for thousands of small random operations. Virtualization performance for databases, package managers, indexing, and snapshot-heavy workloads can be dominated by request latency rather than maximum sequential throughput.
Match the I/O Test to the Actual Task
I separate at least three storage questions. First, sequential throughput: how much data can the configured path move during large transfers? Second, small-block latency and IOPS: how quickly can it complete numerous independent operations? Third, tail latency and consistency: what happens to the slowest requests during flushes, snapshots, concurrent host activity, or sustained writes? These are not interchangeable measurements. A video export, a virtualized database, and a software dependency installation may stress quite different parts of the same storage path.
Microsoft’s Windows performance guidance distinguishes disk read and write latency counters and warns against interpreting momentary spikes as persistent problems. I would collect operation-level measurements during the actual workload, then use a synthetic test only to investigate an identified mechanism. The purpose is to explain the slow task, not to maximize a disconnected benchmark number.
External Drives, Snapshots, and Cache State
If a virtual machine lives on an external SSD, the effective path also includes the enclosure, cable, interface, filesystem, physical capacity, temperature, and any concurrent applications using the device. I would record these conditions rather than treat the name of the SSD interface as a measured speed. Snapshots and virtual-disk growth can change how writes are handled, but the effect depends on implementation and current state. A snapshot is a recovery convenience, not a free performance configuration, and it is not a substitute for a verified backup.
For a fair virtualization performance comparison, I would distinguish a first run after reboot from a warm-cache run. Filesystem caches, downloaded dependencies, precompiled files, and antivirus activity can dominate differences that otherwise look attributable to the virtual disk. I would also monitor free space and any storage errors. If the workload is database-like, a correct fsync/durability policy matters: disabling safe writes merely to produce a better benchmark is not an acceptable optimization.
Avoid Guessing the Controller’s Contribution
Different virtual storage controllers and guest drivers may expose different features. Their relative performance depends on the hypervisor and operating-system combination; unsupported controllers are not valid optimization candidates. Broadcom’s Apple Silicon guidance identifies a recommended NVMe path for supported Windows guests, but product documentation can lag actual releases. I would verify the specific platform build and support status before changing drivers or controller types. The safe diagnostic order is to measure the existing path, identify the observed limit, then test a supported alternative with a recovery plan.
Virtual Graphics: Available, Accelerated, and Actually Used Are Different States
GPU capability is especially easy to overstate. A VM may expose a virtual display adapter, allow a high-resolution desktop, and report that a graphics option is enabled. None of those observations alone proves that a specific browser, CAD tool, game, renderer, or video application is executing its workload through accelerated hardware. Virtualization performance for a GPU-sensitive task depends on the guest driver, exposed APIs, the hypervisor’s translation or passthrough support, and the application’s selected backend.
A Functional Display Does Not Prove Accelerated Rendering
In my previous Windows 11 ARM compatibility audit, the guest displayed a recognized virtual SVGA 3D adapter and reported Direct3D capabilities, while Microsoft Edge’s own diagnostics indicated software rendering for the captured browser session. That is an observed compatibility boundary from a specific October 26, 2026 environment, not a cross-system GPU benchmark. I did not obtain measured frame rates, graphics throughput, or energy comparisons in that audit. The useful lesson is methodological: check the application backend, not merely the virtual hardware name.
For virtualization performance, feature-level exposure, driver availability, hardware acceleration settings, and actual execution are separate questions. For browser-based work, I would inspect the browser’s diagnostics and then test a workload that genuinely uses the graphics capability of interest. For 3D applications, I would verify the supported graphics API and renderer. For video workloads, I would distinguish decode, encode, effects, and display paths. A smooth desktop is insufficient evidence for any one of those tasks.
When More Virtual Graphics Memory Will Not Help
Increasing an exposed graphics memory setting cannot enable an API or a hardware feature that the product does not support. Nor does it guarantee that the application will stop using a software fallback. It may help a workload genuinely constrained by available graphics memory where supported, but that requires a matching measurement and supported configuration. If the platform cannot provide the needed rendering capability, alternatives include moving that task to the host, using a native application, selecting a supported remote workstation, or choosing another environment after validating its feature support.
The trade-off is not simply speed. Remote GPU execution may introduce network latency, data transfer, additional cost, and privacy considerations. A native host application may require a different toolchain. A virtualized workflow may still be valuable for testing, documents, browser-based work, or development even when graphics support is limited. I would make the choice for the actual task rather than assign an overall quality score to the virtual machine.
Virtual Resource Bottleneck Matrix: From Symptoms to Evidence
I use the Virtual Resource Bottleneck Matrix to keep a diagnostic conversation falsifiable. Each row pairs a symptom with evidence collected at the relevant layer, an alternative explanation, and one controlled intervention. It is a conceptual method for prioritizing investigation, not a validated diagnostic classifier. The point is to avoid turning a correlation such as high disk activity into an unsupported certainty about the root cause.
| Observed symptom | Evidence to collect | Competing explanation | Safe next test |
|---|---|---|---|
| Build scales poorly with added vCPUs | Task duration, guest threads, host CPU use, scheduling signals when available | Serial stages, memory bandwidth or disk waits | Compare supported vCPU allocations with identical build inputs |
| Guest pauses during multitasking | Host memory pressure, swap trends, guest working set, fault activity | Background disk I/O or unrelated host processes | Reduce concurrent load or adjust a single allocation and repeat |
| Package install or database writes stall | Read/write latency, request pattern, queueing, host disk activity | Guest paging or remote dependency delay | Repeat with fixed inputs and capture storage and memory timelines |
| Desktop works but 3D task fails or lags | Virtual driver, API support, application rendering backend, logs | Software fallback, unsupported API or application emulation | Validate backend and compare a supported native alternative |
| Work slows only during long sessions | Timed task rate, host contention, thermals, storage and memory pressure | Background jobs or changing cache state | Repeat under documented steady conditions and retain the timeline |
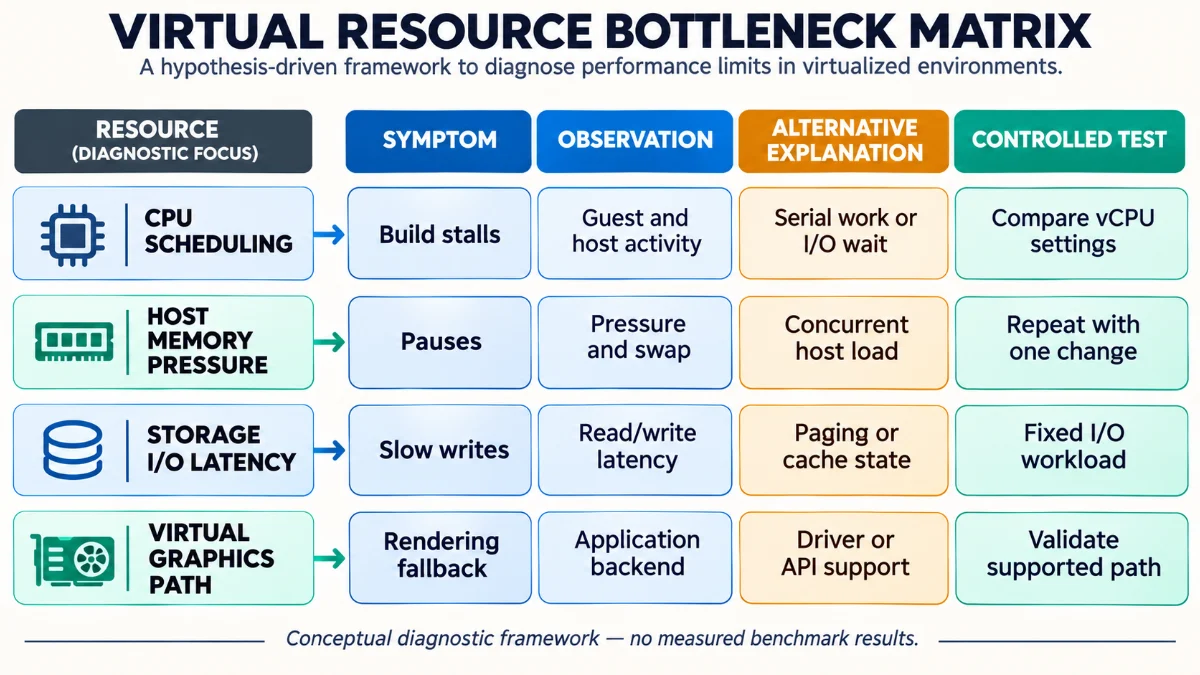
Interpret the Matrix as a Sequence of Tests
The virtualization performance matrix is deliberately not a scorecard. One row may lead to another: memory pressure can cause disk activity, and CPU-heavy software rendering can masquerade as a CPU sizing problem. I would look for evidence in time, change one variable, and repeat the actual task. When the proposed intervention fails to change the expected signal, I would reconsider the hypothesis rather than reinterpret the data to preserve my original guess. This is especially important when the configuration looks impressive on paper but the measured user task has not improved.
A Resource Allocation Matrix for Professional VM Workloads
Virtualization performance allocations should follow the critical task and the host’s real capacity. The following matrix describes what I would inspect before selecting a configuration; it is not a chart of recommended numeric values. A blanket rule such as always assigning half the cores or half the RAM ignores the number of guests, host applications, storage path, and required graphics capabilities.
| Workload | First resource questions | Acceptance evidence | Important caveat |
|---|---|---|---|
| Development and compilation | Parallel build stages, RAM footprint, source-tree I/O | Valid build time and interactive host responsiveness | More vCPUs do not remove serial build stages |
| Database or local services | Memory working set, fsync behavior, small I/O requests | Consistent operations and correct committed data | Unsafe caching can invalidate the comparison |
| Browser and office workflows | Display backend, memory pressure, input response | Correct task completion and responsive interaction | Good desktop behavior does not prove 3D acceleration |
| GPU-sensitive creation | API, driver, acceleration backend, memory support | Correct output and workload-specific rendering evidence | Capability may be absent regardless of vCPU count |
| Multiple concurrent guests | Combined CPU demand, host memory, storage sharing | Per-guest success and acceptable host behavior | Each guest tested alone can hide shared contention |
A Reproducible Virtualization Performance Test Protocol
A credible virtualization performance test records enough information to let another professional understand the constraints, repeat the procedure, and dispute the interpretation. I would use a bounded workload rather than a long list of unrelated synthetic scores. The practical goal is to learn whether a configuration can complete the intended task with acceptable quality and responsiveness.
1. Freeze the System and Workload Identity
Record the host processor and memory, host OS version, hypervisor name and build, guest architecture and OS build, assigned vCPUs and RAM, virtual disk controller, physical storage path, virtual graphics device and guest integration tools. Document power mode, connected displays, external-drive interface, background applications, and whether other VMs are active. Give the test input a version, commit hash, fixed dataset, or equivalent immutable reference. If these conditions are missing, a later run may not be comparable even when the visible task name is unchanged.
2. Establish a Correct Output and Baseline
Choose a task with clear completion criteria, such as compiling a fixed repository with tests, exporting a fixed media asset with specified settings, or processing a controlled dataset. Verify the resulting artifact before treating any time measurement as success. Record a baseline with the present VM configuration and a stated cache condition. For a browser or UI task, define the interaction to perform and the relevant responsiveness threshold rather than relying only on a vague impression that the desktop feels smooth.
3. Observe Host and Guest at the Same Time
Collect guest CPU and memory activity, relevant process metrics, disk operations and latency, and any application-specific errors. In parallel, record host CPU load, memory pressure, storage contention, and available virtualization counters. For Linux, PSI can be a useful additional stall signal; for macOS, Activity Monitor’s memory pressure and swap indicators are more appropriate than a Linux-only file path. The timestamps should be aligned closely enough to connect a task pause with events in its resource path.
4. Change One Cause at a Time
If CPU scheduling is the suspected virtualization performance limit, compare permitted vCPU allocations without also moving the disk or changing the application. If memory pressure is the hypothesis, preserve the task while adjusting one relevant memory or concurrency variable. If storage is suspected, investigate the existing path and compare a supported alternative with a backup. If graphics are suspected, verify the application’s backend before changing unrelated processor settings. Each variation needs the same acceptance criteria and a documented restoration path.
5. Repeat, Compare Distributions, and Report Limits
One run can identify an obvious failure, but it is weak evidence for a stable virtualization performance difference. I would run repeated comparable trials, preserve individual durations, note warm- versus cold-cache conditions, and report the spread rather than only the best number. When a workload depends on responsiveness, tail latency and failed interactions deserve attention alongside average duration. The test cannot establish general performance superiority beyond its selected input, host conditions, versions, and measured task.
6. Publish a Decision and a Rollback Rule
The final record should name the accepted configuration, the task it improved, the counterevidence, and the effect on the host and other workloads. A virtualization performance optimization is not useful if it creates unacceptable memory pressure, reduces reliability, violates data durability, or prevents a required application from functioning. Preserve the previous VM settings and a verified recovery path before major controller or disk changes. Results that do not support the proposed change are valuable findings, not an excuse to alter the acceptance test after the fact.
Three Illustrative Bottleneck Investigations
Scenario One: A Development VM Builds Slowly
Imagine an ARM64 development guest that compiles a large codebase. The first instinct might be to double its vCPU allocation. Instead, I would inspect whether the compiler actually keeps the assigned virtual processors busy, whether the build consists of serial stages, and whether dependency extraction is dominated by filesystem activity. A controlled comparison could reveal that CPU capacity matters, or that the build is constrained by disk and memory behavior. The scenario has no measured result; it illustrates how competing explanations should be distinguished before virtualization performance tuning.
Scenario Two: Everything Becomes Sluggish After Opening a Second VM
Consider a host where the first guest works well alone but both guests slow down when running together. I would not immediately buy faster storage. First I would correlate host memory pressure and swap with the start time of the second guest, while checking whether CPU contention or competing I/O increased. Repeating the same task with one guest versus two establishes an informative condition. A resource allocation matrix is useful here because the right answer may involve concurrent workload limits, not a larger individual guest configuration.
Scenario Three: Browser Graphics Fail Despite a Working Desktop
Suppose the guest display scales correctly and a graphics adapter is present, yet a browser’s diagnostics show software rendering. That pattern resembles the type of difference documented in my prior compatibility audit, but it does not establish the same underlying cause on a different system. I would collect guest driver details, browser diagnostics, supported API information, and a reproducible task. A CPU upgrade is not the logical first intervention if the application is using a fallback due to unsupported virtual graphics functionality. A virtualization performance claim about graphics must follow the rendering path.
Trade-Offs: When the Right Answer Is Not More Virtualization
Sometimes improving virtualization performance is not the right objective because the hypervisor itself is not the right execution environment for the application. Native software can avoid guest-architecture and virtual-device constraints, but it may not provide required operating-system compatibility. A remote system can offer a different CPU or GPU capability, but adds network dependency, cost, data-handling implications, and interactive latency. A dedicated physical machine can remove some virtualization boundaries while sacrificing flexibility, portability, or consolidation. Each is a legitimate choice under the right conditions.
Virtualization remains valuable when isolation, reproducible environments, operating-system coverage, snapshot-based experimentation, or safe maintenance outweigh a particular performance limitation. I would not abandon a working setup merely because a synthetic benchmark is slower than native execution. Nor would I continue relying on a VM for a critical unsupported graphics task just because the operating system boots. The decision needs a declared workload, a supported feature set, acceptable costs, and a recovery path.
There is also a sustainability question. Allocating more host capacity than the task needs can reduce availability for other work. Aggressively optimizing a demo can increase review and maintenance costs if the configuration becomes fragile or difficult to reproduce. The best virtualization performance decision is not necessarily the configuration with the highest isolated score; it is the one that produces valid work with predictable resource use under the conditions a professional actually faces.
Evidence, Limitations, and What This Article Does Not Prove
This virtualization performance analysis combines official technical documentation with a proposed diagnostic model. It does not claim new CPU, memory, storage, or GPU benchmark results from my hardware. My October 2026 Windows 11 ARM article provides a real compatibility observation, but its measurements were not designed to establish throughput, storage latency, graphics frame rates, host memory pressure, or performance gains from changing virtual-machine allocations. Reusing that study as if it answered these questions would cross the evidence boundary.
Vendor documentation also has version boundaries. A Fusion compatibility note updated in 2025 may describe limitations or integrations differently from a later build observed in 2026. I therefore avoid declaring a historical feature matrix to be universally current. Hardware architecture, hypervisor release, guest build, virtual drivers, and specific application behavior all need explicit verification at the time of a new test. Similarly, enterprise ESXi CPU-ready counters are explanatory examples, not proof that identical statistics are available in a desktop Fusion session.
Finally, these diagnostic categories interact. CPU waiting, host swapping, disk latency, and software graphics rendering can overlap or cause one another. The matrix offers a way to produce testable hypotheses; it cannot guarantee a unique root cause from a single signal. Where the available evidence fails to distinguish alternatives, the correct conclusion is unresolved, with a clear next measurement.
Frequently Asked Questions
Does assigning more vCPUs always improve virtualization performance?
No. More vCPUs can help a parallel workload when host scheduling capacity is available, but may provide little benefit for serial work or a guest waiting on memory and disk. The right test compares completed work and host contention under the same workload.
Can a VM run out of useful memory even when the guest reports free RAM?
Yes. Guest-visible memory and host memory pressure describe different layers. A host that is compressing or swapping heavily may affect the virtualization process even if the guest’s internal counters do not signal a shortage. Both systems need observation.
Will moving a VM to a faster SSD always make it faster?
No. Storage may be the bottleneck for some I/O patterns, but a CPU-bound compile, unsupported graphics backend, or memory-pressure problem may not improve. Measure the actual read/write latency and workload before and after a supported change.
Is ARM virtualization the same as x64 emulation?
No. An ARM64 guest may execute on ARM hardware through virtualization while an x64 application is separately translated by the guest operating system. The latter adds a different compatibility and performance mechanism, and kernel-mode drivers require native architecture support on Windows on Arm.
Does enabling 3D acceleration guarantee hardware-rendered applications?
No. The virtual device, guest driver, API feature set, hypervisor support, and application backend must align. An application can use software rendering even when a guest-level graphics setting appears enabled.
What is the most useful first virtualization benchmark?
One reproducible task that represents the intended professional workload, with correct output and observations from both guest and host. Synthetic tests are useful afterward to investigate a suspected limiting resource, but they should not replace the actual task acceptance criteria.
Conclusion: Optimize the Boundary That Limits Valid Work
Virtualization performance is not a single property of the hypervisor or a percentage of native CPU speed. It emerges from the interaction between the workload, CPU scheduling, host memory pressure, virtual storage, graphics capability, and application architecture. A resource allocation is merely the starting configuration. The useful evidence is what the task completed, how reliably it completed, what it waited for, and what the host had to sacrifice.
My preferred workflow is to define the task, observe both sides of the virtualization boundary, map the symptom to multiple plausible causes, and change one supported variable at a time. The Virtual Resource Bottleneck Matrix makes those assumptions explicit and creates a record that another engineer can challenge or repeat. If the evidence supports a different execution environment rather than a larger VM, that is a valid architectural conclusion.
The objective is not to defend virtualization or to maximize a configuration sheet. It is to make a workload dependable. When the task, the resource budget, and the observable limits are aligned, virtualization becomes a deliberate engineering choice rather than a guessing exercise.
Related Research and Further Reading
For a real compatibility audit that separates operating-system behavior from application graphics support, see my Windows 11 ARM in VMware Fusion: Compatibility Lab. For the separate question of how performance changes over time under sustained load, explore Sustained Performance: Beyond Peak Benchmarks. Browse the broader Technology & Hardware Articles collection for the surrounding platform and hardware decisions.
Connect and Follow My Work
I publish technical research, engineering analysis, product decisions, and design work across LinkedIn, X, Threads, GitHub, and Behance.