


Role-Based Information Architecture for Complex Products

Interactive Sound Design: Feedback, Timing, and Narrative
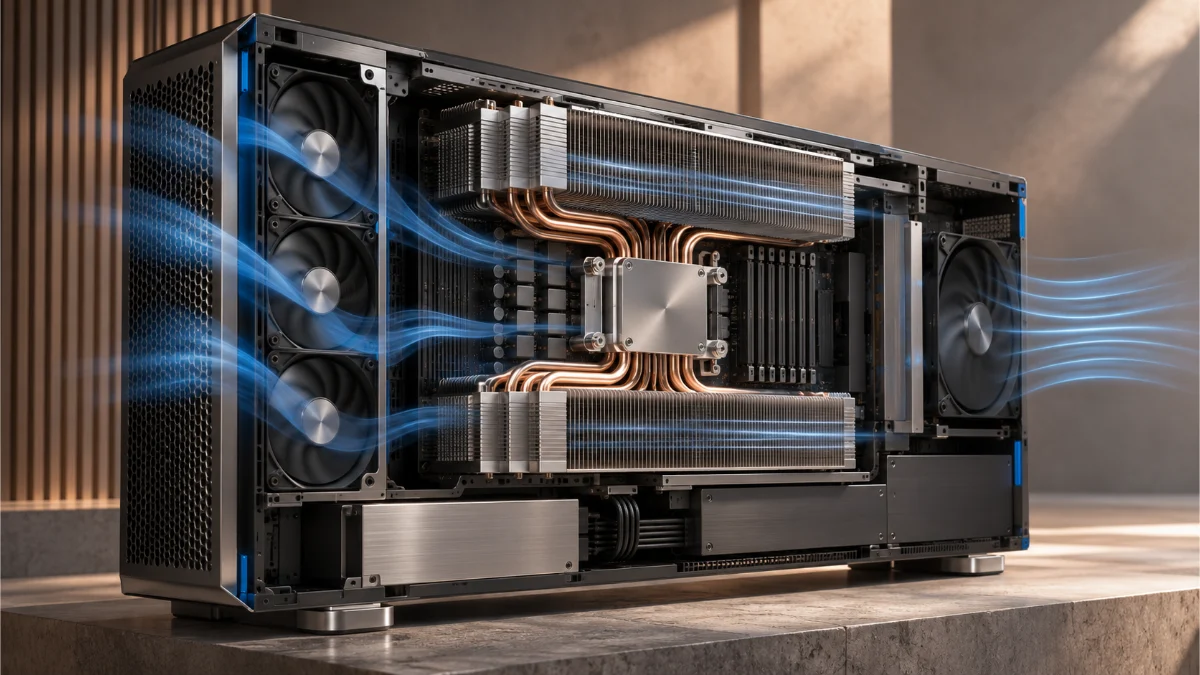
Decision Brief: Measure the Work That Survives the Heat
When I evaluate a computer for long rendering sessions, software builds, creative production, or sustained computation, I do not treat its highest benchmark score as the answer. I want to know what happens after the system stops behaving like a freshly cooled machine running a short demonstration. Sustained performance describes the useful rate of work a configuration can maintain under a defined workload and operating environment. It is a property of the whole system, not simply a number printed next to a processor model.
My decision rule is to retain peak benchmark scores as one piece of evidence, then add three questions: How much useful work is completed over the time that matters? What does that work cost in energy and acoustic disturbance? How stable and reproducible is the result when the same task is repeated? A faster first minute can be valuable, but it does not automatically produce a faster or more practical four-hour session.
This article develops a Sustained Workload Evaluation Framework for choosing and reviewing professional systems. It is an analytical method, not a report of new measurements on my MacBook Pro or a desktop. The example scenarios are illustrative, and no comparative results or wattage figures are presented as observed device data.
Why Peak Benchmark Scores Cannot Describe the Whole Session
A peak benchmark can answer a useful narrow question: how quickly did a system complete or score a defined workload under the benchmark’s rules and the conditions of that run? The problem appears when that answer is silently expanded into a promise about a different task, a different duration, and a different environment. A system that finishes a short CPU burst quickly might have no advantage during a memory-limited pipeline. A GPU that posts an impressive first loop may later deliver different sustained performance under changed clocks or power constraints. Conversely, a well-cooled desktop might remain close to its initial rate for the full session.
I separate three terms that are often mixed together: instantaneous or short-window peak performance, measured sustained performance over a stated window, and overall task completion time. The first is sensitive to transient boost behavior. The second describes throughput or latency across an explicit measurement period. The third answers the operational question most people actually care about: when is the deliverable finished? These can produce different rankings because workloads have initialization, caching, transfer, CPU, GPU, storage, and idle phases.
There is also a naming trap. The term peak in SPEC CPU2017’s base-versus-peak methodology refers to permitted compiler optimization choices, not to a brief thermal burst. SPEC’s reporting rules emphasize documented conditions and repeated runs. I would never interpret its named peak metric as if it directly measured a cooling system’s first few seconds of operation.
Workload Duration Changes the Question
Imagine two users considering the same portable computer. One opens photographs, edits individual documents, and occasionally exports a short clip. The other runs consecutive long exports, a virtual machine, and a build pipeline throughout the afternoon. The first may benefit more from responsiveness and fast short tasks. The second has more reason to care about sustained performance, predictable cooling, power delivery, and recovery between jobs. The duration that makes sustained performance meaningful is determined by the activity, not by a universal benchmark stopwatch.
For a build pipeline, I would measure an end-to-end clean build and a representative incremental build separately. For rendering, I would distinguish a fixed-scene completion time from throughput in a repeated scene batch. For a live creative timeline, I would examine playback interruptions and export success rather than substituting a synthetic GPU score. The test must represent the decision being made.
The Transition From Burst to a Repeatable Operating State
Modern computers can change frequency, voltage, fan speed, and power allocation dynamically. During a short task, the machine may draw on thermal headroom that is no longer available later. During sustained work, the control system balances several limits: component temperature, electrical power, current, available cooling, battery or adapter state, and platform policy. A transition in sustained performance is not necessarily a fault. It is part of how the device is engineered to operate.
Intel’s support documentation on processor power behavior describes how platform power limits such as PL1 and PL2 can affect longer runs, and notes that motherboard defaults may change those limits. The specific behavior is product- and configuration-dependent. That matters because two computers with a similarly named processor may deliver different sustained performance under different platform policies. Sustained performance should be attributed to the tested configuration rather than assumed from the CPU label alone.
Thermal Throttling, Power Limits, and the Cooling Envelope
Thermal throttling is a real mechanism, but it is not a synonym for every decline in sustained performance over time. A system can reduce clocks because a power budget was reached even when temperatures remain within normal operating conditions. A workload can slow down because memory pressure causes paging, a shared GPU is occupied, cache behavior changes, storage writes become slower, or background tasks interfere. An honest sustained performance assessment has to distinguish those possibilities before assigning a cause.
According to Intel’s processor temperature guidance, operation near a designed temperature limit during sustained workloads is not automatically evidence that the computer is defective; the platform monitors and controls power and frequency. The correct question is whether the observed rate, safety behavior, and operating conditions fit the device’s specified design and the user’s workload. Temperature alone does not establish how much sustained performance or useful work was lost.
Power Limits Are Not the Same as a Thermal Failure
A platform power limit is a budget that constrains consumption and may bound sustained performance. When software or firmware applies a lower budget, the system may stabilize at a lower frequency even with adequate cooling. That may be intentional: a thin laptop might prioritize surface temperature and fan noise, while a desktop can sustain more electrical power and dissipate more heat. I would not call the lower-power configuration inferior without showing how its energy use, workload duration, acoustics, and physical constraints affect the actual buyer.
The NVIDIA System Management Interface documentation distinguishes software power capping, thermal slowdown, hardware thermal slowdown, and external power braking. Those event categories show why a falling GPU clock is not a complete diagnosis. Monitoring support varies by product and driver, so an unavailable field should be recorded as unavailable rather than replaced with a guess.
What Thermal Equilibrium Does and Does Not Mean
A common way to interpret a sustained performance test is to look for a period in which temperature, power draw, clocks, and work rate stop changing substantially. That may suggest the system has reached an approximately stable operating state under those conditions. It does not prove every component has reached perfect thermal equilibrium or that a future workload will behave identically. Room temperature, air circulation, surface contact, dust, battery state, firmware, and accumulated background work can all change the result.
My preferred approach is to publish the sustained performance time series rather than declare that every machine reaches steady state at minute twenty. A sensible window is long enough for the relevant task and any observed transition, then repeated under comparable conditions. If a workload remains variable, report the variation. If the machine stabilizes quickly, state that. If the test finishes before thermal behavior changes, do not infer what would have happened later.
Cooling Capacity Has an Acoustic Price
Fan noise is not an afterthought in a studio, a shared office, or a quiet home workspace. A machine can improve sustained performance by allowing fans to run faster, yet become less pleasant for recording audio, holding calls, or concentrating nearby. Apple explicitly explains that High Power Mode on supported Mac models can increase fan speed and may improve demanding graphics work through additional cooling. Its Low Power Mode guidance also connects reduced energy use with quieter operation on supported systems. That is a platform-level example of a performance-and-noise trade-off, not a benchmark result for my own computer.
For a fair acoustic comparison, I would record the microphone or sound meter used, its position and distance, the ambient noise floor, the room, the device orientation, the weighting method, and the workload phase. The NIOSH Sound Level Meter documentation illustrates why measurement method and device capability matter. An uncalibrated phone reading from an unspecified distance is not a defensible cross-device noise ranking. Subjective annoyance may also differ even at similar measured sound levels because the sound’s character changes.
What to Measure: Work, Stability, Energy per Task, and Noise
To compare sustained performance, I want a small set of measures that describe the outcome and the constraints together. A benchmark score may still be included, but it should not displace task completion time. Every result needs an explicit unit and a stated denominator. Faster throughput is not the same kind of number as lower latency, and power in watts is not energy in watt-hours.
Completed Work and Performance Stability
Useful throughput might be frames rendered per minute, scenes finished per hour, builds completed per session, or items processed per second. For a single task, end-to-end duration and completion status may be more important than average throughput. If the user interacts with the system during the job, I would also record foreground responsiveness or relevant tail latency. A machine that completes background rendering quickly but makes normal interaction unusable is not necessarily the better workstation for that person.
Sustained performance stability asks whether the work rate changes across repeated comparable intervals. I would publish the first, middle, and late work rates when they are meaningful, then examine the full series for transitions and outliers. One useful example of an existing, clearly defined stability metric comes from UL’s 3DMark stress-test methodology: it compares average frame rates in the worst and best loops. That metric is specific to its graphics stress test. It should not be presented as an interchangeable score for compilation, 3D rendering, video editing, or every other sustained workload.
Energy per Task Is Different From Average Power
Power tells me how fast energy is being used at a moment; energy tells me how much was consumed across the job. If a device draws a relatively high average power but finishes much sooner, its total energy per completed task may be lower than that of a slower system. The opposite is also possible. For a task with a fixed output, the primary metric I would report is measured watt-hours per completed, valid result, with elapsed time and average wall power shown alongside it.
The relationship is straightforward: for constant power, energy in watt-hours equals power in watts multiplied by time in hours; for changing power, integrate the power trace over the measurement window. The underlying distinction is explained in the U.S. Department of Energy’s energy fundamentals material. The measurement boundary matters. A wall meter includes more than CPU or GPU package power, while package sensors exclude other parts of the system. I would never mix those values in a single energy ranking without clear labels.
In professional testing, I would disclose whether the measurement includes the display, adapter losses, peripherals, storage enclosure, or battery charging. On a laptop running from its battery, a wall reading is not equivalent to total device energy consumption. If a device was charging during an AC test, the reading may reflect battery replenishment as well as task energy. Incomplete monitoring is a limitation to report, not a reason to manufacture an energy-per-task number.
Performance per Watt Needs a Defined Workload
The phrase performance per watt can mean different things depending on the numerator. For fixed, valid output, a rate of completed work divided by average measured power can describe throughput efficiency under that particular workload. It does not automatically generalize across different apps, input sets, accelerators, software versions, or output quality levels. I prefer energy per valid completed task when comparing end-to-end production, because the denominator corresponds directly to a deliverable.
A fair sustained performance evaluation should also disclose failures and reruns. If one system finishes a job faster but produces an invalid file, crashes halfway through, or requires manual recovery, the initial measured work rate is not the total operational outcome. Error correction and rework consume additional time and energy. Sustained performance belongs inside a quality-controlled workflow rather than outside it.
A Practical Measurement Set
| Dimension | Primary measurement | Interpretation boundary |
|---|---|---|
| Work completed | Valid outputs, throughput, or task duration | Define identical inputs and acceptance criteria |
| Performance stability | Time series of task rate or loop duration | Do not infer cause from a downward trend alone |
| Power and energy | Watt-hours per completed job; measured power trace | State wall-versus-component boundary and battery status |
| Thermal behavior | Available temperature, clocks, power and limit indicators | Sensor support and thresholds vary by platform |
| Acoustics | Specified sound-level method and ambient baseline | Measurement distance and room must match |
| Reliability | Success, errors, retries and recovery events | Incomplete or corrupted work cannot count as success |
| Interactive usability | Relevant response time or interruption count | Measure only if foreground interaction matters |
A Reproducible Benchmark Methodology for Long Workloads
A good sustained performance benchmark methodology starts before the timer. If I were preparing a sustained performance review, the first question would be which professional decision the result is supposed to support. I would then choose a representative workload, preserve its input and output constraints, and document the physical and software environment. Without those controls, even a precise-looking chart can compare different problems rather than different machines.
1. Define the Work and Its Acceptance Criteria
Pick a job someone would actually repeat: render the same licensed scene with the same quality settings, build the same repository at the same commit, export the same source video using an equivalent codec and preset, or process a fixed batch of files. Confirm that each result is valid before counting it. Record software versions, hardware acceleration backends, thread settings, memory allocation, and relevant plugins or extensions. If a change improves speed by reducing output quality, the comparison is not like-for-like.
Blender Open Data offers an instructive example of a bounded performance metric. Its benchmark description defines score in terms of Cycles path-tracing samples per minute across benchmark scenes. That is meaningful for the stated Blender workload, but it does not automatically predict gaming frame rates, video encode speed, or sustained AI inference. To assess sustained performance for those other tasks, the measurement must change with the question.
2. Control the Environment Without Hiding Realism
Record the model and configuration of each system, firmware, operating-system build, drivers, application versions, connected displays, power mode, adapter, battery state, ambient room temperature, surface and airflow arrangement. Do not silently switch a laptop into a high-fan mode for one comparison and leave another in its default quiet mode. If the intended use case is battery-powered work, test that as an independent condition rather than combining it with AC-powered results.
Some controls should also represent reality. A laptop that only maintains its best rate with the lid open on a special stand may still be useful, but that condition must be visible to the buyer. A desktop tested on an open bench is not necessarily equivalent to the same parts inside a restricted case. Fairness means comparable disclosures, not pretending different form factors are identical.
3. Run a Cold Pass and Repeated Sustained Passes
First, collect a cold-start or rested-system pass if that state is relevant. Then repeat the same valid job or loop the same workload long enough to observe any performance transition. Store a timestamped record of completion times, temperatures, clocks, power estimates or measurements, and any available limit flags. Track enough repeats to understand ordinary variability; a single exceptional run should not determine the conclusion. Return the machine to a documented starting state before independent comparison sessions.
There is no universal duration that works for every system and task. UL describes a default 20-loop graphics stress test that typically runs for about twenty minutes, designed to expose graphics stability and cooling problems. That is a useful test design for its own purpose. A real overnight render, a long interactive build session, or a workload with alternating idle and heavy phases may require a different procedure. I would select the duration based on the claimed usage, report the stopping rule, and extend testing if the results are still changing.
4. Separate Observation From Diagnosis
Suppose a performance trace falls after several iterations. The correct first statement is that the observed task rate declined under the recorded conditions. Next, examine power-limit indicators, thermal data, memory and swap activity, storage throughput, background jobs, and whether the software changed its work over time. If the necessary sensor data are missing, say that the mechanism could not be isolated. A correlation between heat and lower clocks is not, by itself, proof of a thermal protection event.
For GPU workloads on supported NVIDIA systems, NVIDIA’s documented clock-event reasons can strengthen diagnosis by identifying whether power capping or thermal slowdown conditions were reported. These are still telemetry signals that need context, and unavailable capabilities vary by device. For other systems, use their supported vendor tools and disclose any gaps; do not invent a universal cross-platform sensor API.
5. Publish Distributions, Not Just the Best Number
At minimum, I would retain the per-run values, median or another declared summary, a measure of spread, the earliest and later periods, the total task completion time, and all failures. The SPEC CPU2017 reporting rules offer a rigorous example of why repeatability and disclosure matter, including repeated benchmark runs and detailed conditions of observation. A custom workstation test should not call itself SPEC-compliant unless it actually follows the relevant suite’s rules. It can nevertheless adopt the broader principle of transparent, reproducible measurements.
The sustained performance report should explicitly say what was not measured. If there is no calibrated power analyzer, do not publish an exact energy claim. If no reliable acoustic instrument was used, noise may remain a qualitative observation. If no long real-world task was run, the benchmark cannot establish long-session reliability. Removing unsupported columns makes the evidence stronger, not weaker.
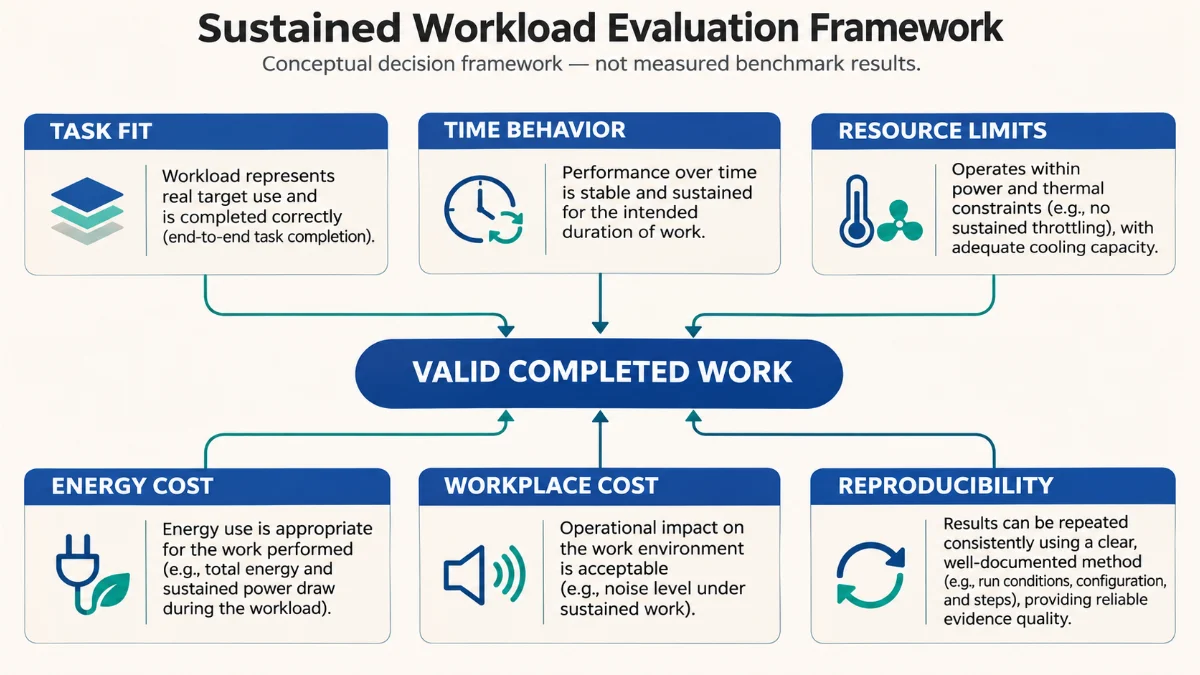
The Sustained Workload Evaluation Framework
For professional hardware decisions, I use the following proposed framework to keep a large benchmark score from obscuring an operational mismatch. It is a structured editorial decision aid rather than a validated industry standard or a weighted numerical ranking. The purpose is to force reviewers and buyers to write down the conditions that make a sustained performance result meaningful and the constraints that could reverse the choice.
| Decision domain | Question | Evidence to request |
|---|---|---|
| Task fit | Does the test represent the actual deliverable? | Matching software, settings, output quality and input set |
| Time behavior | Does the useful rate change as the run continues? | Per-interval performance, repeats, failure logs |
| Resource limits | Which constraint actually bounds the result? | Verified power, temperature, memory, storage and throttling signals |
| Energy cost | How much measured energy is required per valid result? | Consistent measurement boundary and complete time window |
| Workplace cost | Is the noise, heat and interactive impact acceptable? | Comparable acoustic conditions and foreground-use observations |
| Reproducibility | Would another reviewer understand and repeat the outcome? | Versioned methods, environmental notes, raw summaries and limitations |
There is no requirement to turn these domains into one secret score. Different professionals will place different emphasis on them. A mobile editor working near a microphone may accept a longer export to get a quieter system. A render workstation in a dedicated machine room may prioritize throughput and unattended reliability. A developer may value a fast incremental build and responsive editor more than maximum synthetic multicore output. A recommendation is only as good as the workload and constraints it declares.
When Peak Performance Really Does Matter
Rejecting a simplistic ranking is not the same as rejecting short benchmarks. Interactive tasks, brief compilations, application launches, small file conversions, and latency-sensitive actions can be dominated by burst behavior. For those tasks, high short-window performance may be exactly what the user needs. I would measure it directly and resist forcing every decision into a long thermal stress test. This sustained performance framework asks which time horizon is relevant, not whether long tests should always win.
Two Hypothetical Systems, One Better Question
Consider a hypothetical compact laptop that finishes a short render preview quickly but slows during consecutive exports, and a larger workstation that starts at a less impressive rate yet stays consistent across a batch. Without actual task completion times, power traces, and output checks, no responsible reviewer can conclude which one produces more finished work per hour or consumes less energy per project. The larger workstation might win on throughput; the laptop might win on portability, idle noise, or a user’s short-task pattern. Both are possible, and neither is a measured finding here.
This is why I would frame a buying recommendation around observable thresholds rather than a headline. How frequently is the sustained workload used? Is a small extra waiting time costly? Does the user need to work interactively during rendering? Is the noise floor important? Can the system repeat the job without intervention? Sustained performance becomes decision-relevant only when tied to those practical questions.
How Sustained Performance Changes Across Professional Workloads
Rendering and Video Production
For 3D artists, a short scene score is a starting point; full scene completion, memory fit, viewport usability, and unattended output reliability are closer to the real job. For video production, codec support and accelerator implementation can matter more than raw CPU or GPU peak scores. A system that finishes a specific export quickly through supported hardware acceleration should not be compared with another forced onto a software-only path without disclosing that difference. The most honest sustained performance result names the application, backend, codec, quality settings, and exact task.
Long rendering sessions also reveal why fan noise and thermals deserve equal visibility. A machine may remain fast by increasing its cooling effort. That can be an acceptable trade-off in a render room but disruptive on a desk near sensitive audio equipment. Sustained performance needs to be judged in the environment where the work happens, not in an imaginary noise-free laboratory.
Software Builds and Development Sessions
Compiling code often alternates among CPU-bound compilation, dependency resolution, disk access, linking, and idle periods. A synthetic CPU stress test may not reproduce this pattern of sustained performance. In my view, a development-oriented review should compare clean and incremental builds, verify correctness, keep repository state consistent, and show whether editors, browsers, and local services stay responsive while the work runs. Memory capacity and storage behavior can reverse a CPU-focused ranking.
Thermal conditions can still matter during successive builds, but a slower second build is not automatically evidence of thermal throttling. Dependency caches, changed source files, antivirus activity, and incremental compilation behavior can alter the task itself. The protocol must say what has been controlled and what remains variable before interpreting the time series.
Virtual Machines and Mixed Workloads
Virtualization adds another layer of shared resources. Host operating-system work, guest memory pressure, storage contention, and graphics backends affect the task. My previously published Windows 11 ARM compatibility audit in VMware Fusion is an example of why a working environment is not automatically a performance-validated one. It documented selected functional checks and a browser graphics limitation, but it did not establish controlled long-duration throughput, energy, or comparative sustained performance. Those are separate sustained performance investigations.
If I wanted to compare VM hosts fairly, I would fix the guest image, workload, resource allocation, host power state, storage conditions, and software versions. I would then report guest-task completion alongside host contention and reliability. A short host benchmark cannot answer whether the guest remains responsive while another workload competes for the same memory and CPU budget.
Local AI and Other Accelerator-Heavy Tasks
Local model inference may alternate between prompt processing, token generation, memory allocation, and pauses. A brief burst of tokens per second is not a universal sustained performance figure for a real session. Model size, quantization, context length, batching, memory capacity, compute backend, and output validation all influence the result. For a meaningful comparison, use a fixed task and model configuration, distinguish latency to first result from ongoing throughput, and repeat under controlled temperature and power conditions.
I would also avoid assuming that a higher-power GPU automatically provides a better professional workflow. If a workload is limited by memory capacity, unsupported kernels, or data movement, a faster nominal compute unit may not improve completion time. The sensible evaluation begins with what the task needs and only then considers which hardware characteristics matter.
Evidence, Limitations, and What Would Change My Assessment
This article synthesizes publicly documented hardware behavior and benchmark methodology into a proposed decision process. It does not include newly collected thermal traces, calibrated noise readings, power-meter logs, or a controlled comparison of specific workstations. It therefore cannot establish that one MacBook Pro, desktop processor, laptop chassis, or GPU delivers superior sustained performance in any particular environment. Any future product-specific claim would require a test environment, reproducible inputs, raw measurements, and an explicit uncertainty statement.
The main limitations of the framework are measurement access and workload diversity. Not every platform exposes equivalent temperature, clock, fan, or power information. Some software changes its behavior through caching or adaptive scheduling, making repeated passes only partly comparable. Acoustic readings depend on the room and instrument. A test that carefully controls those variables can still miss the practical value of battery life, portability, physical comfort, serviceability, and software compatibility. Forcing all these into one score would create an illusion of precision.
What would change my assessment? Evidence that a short peak score accurately predicts the specific real-world task over its intended duration would reduce the need for separate sustained testing in that case. Conversely, repeated results showing major time-dependent degradation, greater energy per valid task, unacceptable noise, or reliability failures would make sustained performance central to the buying decision. The test should be capable of disproving the original preference, not designed to protect it.
Frequently Asked Questions
Is a peak benchmark score useless for a professional workstation?
No. It can describe performance under a defined short or benchmark-specific workload and may correlate with work that depends on bursts. The mistake is to use that result as a substitute for long-session throughput, completed tasks, or environmental costs without testing the relationship. Keep the peak result, identify its limits, and add measurements suited to the actual work.
Does a high CPU or GPU temperature automatically mean thermal throttling?
No. Temperature is one observation, while thermal throttling is a control action with a specific cause. Components may operate near designed limits without a malfunction, and frequency reductions can also follow power or current constraints. Use supported limit indicators and a time-aligned performance record before diagnosing the mechanism.
How long should a sustained workload test run?
Long enough to represent the intended task and observe relevant time-dependent behavior, with repeated comparable measurements. A looping graphics stress test may use a defined duration, but that does not create a universal threshold for video work, build pipelines, or all-day rendering. State the test’s stop rule and avoid claiming steady state when the data still change.
Why compare energy per task instead of only performance per watt?
For a fixed valid output, energy per task accounts for both how much power the full system uses and how long it must run. Performance per watt is also useful when the work-rate definition and power boundary are explicit, but it can obscure setup, retries, and end-to-end completion. Compare equivalent outputs using consistent wall or component measurement methods, never an unlabeled mixture.
Can I compare fan noise from online recordings?
Recordings can convey sound character, but their level depends on microphone placement, gain, processing, playback equipment, and room acoustics. They are not controlled cross-device sound-level measurements. A repeatable comparison should specify the instrument, weighting, distance, ambient baseline, and operating state, and note whether the device or microphone was calibrated.
Should I always buy the machine with the highest sustained throughput?
No. Buy for the workload and constraints you actually have. A high-throughput workstation may be unnecessary for short interactive work or unsuitable for a quiet, portable setup. A slower machine may be preferable if it meets the production deadline with lower energy consumption, less noise, or better software compatibility. The correct decision should remain sensitive to evidence rather than to a single headline rank.
Conclusion: Choose the Machine That Finishes the Work
Peak scores can tell me something real about a system, but they answer a smaller question than most professional purchasing decisions require. The result I care about is the validated work a machine completes under the operating conditions the user will face. Sustained performance is therefore not a competition to see which chassis stays hottest or which fan spins fastest. It is an evidence-based view of useful output across time, tempered by energy, noise, stability, and reproducibility.
My recommendation is to start with the actual task, use repeatable passes, publish the transition from early to later behavior, and interpret power and thermal data without jumping to causal conclusions. Then ask whether the gains matter to the user’s time, workplace, and budget. A credible sustained performance benchmark should make the trade-off visible even when it challenges the reviewer’s initial preference.
The best outcome is not a universal leaderboard. It is a defensible decision: this configuration finishes this kind of work, within these constraints, with these known limitations. That is a more durable form of hardware evidence than a peak number detached from the session it is supposed to improve.
More From the Author
Explore related hardware architecture and workflow research in my Technology & Hardware Articles collection.
Follow my work across LinkedIn, X, Threads, GitHub, and Behance.