


RAG System Design: Retrieval, Grounding & Citations

Unified Memory vs VRAM: Real-World Capacity Planning

UX research triangulation becomes essential when three credible sources appear to describe three different products. Interviews suggest that people find an experience frustrating. Product analytics show that many active users complete the relevant flow. A moderated task test reveals hesitation, misinterpretation, or an unexpected workaround. The tempting response is to choose whichever result supports the team’s existing direction. The more useful response is to ask whether those methods studied the same people, task, product state, and definition of success.
I would not treat disagreement as a contest between qualitative and quantitative research. Each method observes a different part of an experience, sometimes under different conditions. Interviews help reveal recollections, expectations, motivations, and language. Analytics records instrumented behavior among people who reached a particular product state. Task tests show what participants can accomplish under an explicit scenario and how they approach the work. Contradictions are often information about the boundary between these observations rather than evidence that one research method has failed.
My approach to UX research triangulation is to preserve those boundaries before synthesizing a recommendation. I want to know exactly which question each study answered, what it could not observe, how its participants were selected, and whether the decision being considered is actually supported. This article develops an Evidence Reconciliation Matrix and a research decision trace for that work. The framework is my proposed analytical synthesis, informed by published research methodology rather than presented as a tested industry standard or a result from a particular client engagement.
Decision Brief: Investigate the Disagreement Before Averaging It Away
The problem: A team combines interview quotations, funnel metrics, and usability observations into one conclusion even when they describe different populations, exposure conditions, task definitions, or time windows.
The principle: Treat each finding as a bounded claim. Compare the conditions that produced it before deciding whether the findings conflict, complement one another, or describe different user segments.
The method: Build an evidence matrix linking research question, population, observed behavior, method, measurement limitations, competing interpretations, and the next decision-relevant check.
The limit: Triangulation does not transform a biased sample into a representative one, make invalid events accurate, or prove causation from observational agreement. Some decisions remain uncertain after several methods are combined.
What UX Research Triangulation Actually Means
Triangulation means examining a research question through more than one source, method, or analytical perspective to improve the credibility of an interpretation. The Nielsen Norman Group’s explanation of triangulation describes how one method can compensate for another method’s blind spots. Its value is not the number of methodologies listed in a research report. The methods need to contribute relevant evidence about the question at hand.
A team might see analytics indicating that a subscription form frequently fails, then observe task sessions to understand where people struggle. Or interviews may reveal an unexpected motivation that a survey is subsequently designed to examine across a larger, appropriately sampled group. In both cases, evidence sources have different jobs and the second method helps answer something the first could not.
UX research triangulation is weaker when a team places unrelated findings next to one another merely because they were collected during the same quarter. A support ticket about account recovery, a survey about visual preference, and a conversion chart about checkout are not automatically three votes on the success of a new navigation pattern. The first question is whether the evidence can legitimately be compared.
Three Outcomes: Agreement, Complementarity, and Real Conflict
Agreement occurs when independent observations support a compatible, clearly defined claim. Complementarity occurs when one method explains or bounds another: analytics shows where abandonment happens, while a task study reveals a probable source of friction. Conflict occurs when findings make incompatible claims about the same population, task, context, and time period, after the relevant measurement differences have been checked.
I distinguish these outcomes because researchers can waste time trying to reconcile evidence that never contradicted anything. Someone saying that onboarding feels stressful is not logically incompatible with completing onboarding. One statement concerns subjective experience; the other concerns observed task completion. A reliable synthesis may need both.
Begin With One Decision-Relevant Question
Before comparing sources, I would write the decision in plain English. For example: “Should we change the enterprise account setup flow because first-time administrators cannot complete it independently?” This is narrower than “Is onboarding good?” It identifies a user group, a task, a condition of independence, and the business decision that evidence must inform.
The GOV.UK guidance on capturing research questions recommends revisiting questions as knowledge develops. In a triangulation review, the wording matters because a change from “Can users finish?” to “Can users finish without assistance?” can alter the interpretation of every existing data source.
Qualitative User Interviews, Product Analytics, and Usability Testing Answer Different Questions
Researchers often describe these methods as three channels for collecting evidence. That description is useful only if we remember that their outputs have different units. An interview observation may describe one participant’s interpretation. An analytics event may count a session or account rather than a person. A task test may record success under controlled instructions that differ from naturally occurring product use.
In the Nielsen Norman Group’s discussion of contradictory UX findings, Kate Moran recommends checking participants, tasks, logistics, and analysis when quantitative and qualitative findings disagree. That is the methodological foundation I would use before proposing design changes.
Qualitative User Interviews: What People Remember, Expect, and Explain
Qualitative user interviews can help identify unmet needs, reasons for avoidance, mental models, organizational constraints, and perceived risks. They are particularly valuable when a behavior is hard to infer from event data. A participant might say that an approval screen feels unsafe because the consequences of pressing “Confirm” are unclear, even though the analytics record a successful submission.
An interview statement is evidence of what the person reported under those conditions, not automatic proof that every user behaves the same way. Memory, social desirability, the interviewer’s wording, and the participant’s understanding of the task can affect an answer. Someone describing last month’s workflow may also be discussing a different product version than the one instrumented in today’s dashboard.
I would preserve verbatim quotations with their study context, then separate the observed statement from the researcher’s interpretation. The Nielsen Norman Group’s thematic analysis guidance explains how systematic coding supports analysis without relying only on memorable quotes. A theme should not become a universal claim because three articulate participants expressed it vividly.
Product Analytics: What Instrumented Events Can and Cannot Show
Product analytics can identify patterns across instrumented interactions: where sessions end, how frequently a particular action occurs, whether a defined event follows another, and how cohorts differ. This is powerful evidence about recorded behavior, but the conclusion depends on the event definition, denominator, identity model, filtering, and data completeness.
For example, an event called setup_completed might fire when the final screen loads rather than when an administrator has successfully configured an account for actual use. A funnel can look healthy while users finish through support assistance, retry several times, or abandon an essential step that the tracking plan never included. Product analytics cannot reliably measure an uninstrumented requirement.
The unit of analysis also matters. One person can create multiple sessions; one enterprise account can involve several people; automated events can enter the data unless excluded. A session-level completion rate cannot be casually compared with an interview statement about the proportion of administrators who are confident they can manage the account later.
Usability Testing: Task Success Is Conditional on the Study
Usability testing shows how recruited participants perform particular tasks with a particular interface. Moderated sessions can reveal hesitation, unexpected interpretations, assistance requirements, accessibility barriers, and the sequence leading to an error. The GOV.UK moderated usability testing guidance emphasizes realistic tasks and recruiting actual or likely users of the service.
A task success rate is meaningful only alongside a success definition. Did the participant reach an endpoint, complete the task accurately, avoid moderator intervention, and understand the consequence? The measurement may change when a study uses a prototype rather than a production environment, provides an artificial starting point, or allows retries that ordinary users would never attempt.
Small qualitative task studies are useful for discovering problems and understanding mechanisms. They should not be treated as representative population estimates without an appropriate quantitative study design. The Nielsen Norman Group’s discussion of participant numbers distinguishes the aims of qualitative problem discovery from statistical estimation; I would not turn observations from a few sessions into a general market percentage.
A Method Comparison Before Any Conclusion
| Method | Direct observation | Useful question | Claim it cannot establish alone |
|---|---|---|---|
| User interviews | Reported experience, meanings, motivations | Why does this feel risky or confusing? | Population prevalence of a reported problem |
| Product analytics | Recorded events for instrumented activity | Where and for whom does an event pattern occur? | The psychological reason behind a behavior |
| Moderated task tests | Task behavior under specified conditions | Can participants complete the scenario and where do they struggle? | Natural usage frequency across all customers |
| Support records | Problems that reached a support channel | Which failures prompt requests for help? | Frequency among users who never contact support |
UX research triangulation should use these differences as an asset. If all three sources appear to disagree, the next step is to inspect the boundaries of each measurement rather than averaging the conclusions into a convenient but unsupported statement.
Five Reasons UX Evidence Appears to Disagree
The difficult part of UX research triangulation is determining whether the studies can be aligned at all. I would inspect five dimensions before judging the design: who was included, what task was measured, when the observation occurred, how the measurement worked, and under what conditions people interacted with the product.
Sampling Bias and Participant Recruitment
Sampling bias can arise when the people contributing evidence differ systematically from the people the decision concerns. Interview participants may be volunteer power users, analytics may overrepresent returning customers, and usability participants may be recently recruited first-time users. If the product is an enterprise system, the administrative purchaser, the setup administrator, and the daily operator can have different goals while sharing an account label.
Participant recruitment should therefore be examined for eligibility rules, experience level, role, device, accessibility needs, region, plan, and recent exposure to the interface. A researcher does not need identical people in every method, but they do need to understand which differences could change the finding. A disagreement caused by distinct segments can become an important product insight rather than a methodological embarrassment.
The GOV.UK planning guidance ties participant selection to the user groups and research questions. I would apply that principle to reconciling existing studies too: document how recruitment happened, not only how many people participated.
Task Definitions and Exposure Conditions
An interview about someone’s general onboarding experience does not necessarily refer to the same action as a task test that begins halfway through account setup. One study may require a person to establish access controls independently; another may count reaching a confirmation screen. Even an apparently identical task can behave differently when the participant has received training, seen a demo, or used the application repeatedly.
For UX research triangulation, I would reconstruct the exact task instructions, starting conditions, account permissions, and allowed assistance. If the task test permitted hints but the production analytics cannot distinguish supported completion from independent completion, the two metrics may be answering different questions.
Time Windows and Product Versions
A product changed on Monday, analytics describe usage from the following two weeks, and interviews ask people to recall their experience from the preceding quarter. Treating these as simultaneous observations would be a category error. Releases, seasonal activity, onboarding campaigns, policy changes, and changes in traffic composition can all alter the underlying experience.
I would record the observation window separately from the publication or reporting date. A presentation shared yesterday may contain analysis of an old interface. The right comparison is between evidence generated under equivalent product states, not reports that happen to have recent filenames.
Event Tracking and Instrumentation Validity
Event tracking can introduce disagreement when the recorded event does not represent the behavior researchers think it does. A click event may fire on an attempt rather than successful completion; asynchronous submissions may double-count; an error path may not emit an event; consent and tracking restrictions may leave some populations missing.
Before interpreting a dashboard as the stronger evidence, I would inspect the tracking specification, event firing conditions, identity deduplication, filters, and known data gaps. If necessary, reproduce the flow in a controlled test environment to see which events are emitted. That would be a proposed validation step, not something I claim to have performed for this article.
Study Environment, Accessibility, and Observer Effects
Natural product use and moderated testing create different contexts. A participant who succeeds in a calm session may struggle in a noisy workplace, on a smaller device, while multitasking, or while relying on assistive technology. Conversely, a participant may hesitate because the moderator’s presence or the artificial task framing changes their behavior.
Accessibility is a particularly important boundary. A metric dominated by users of conventional desktop input cannot establish that the flow works for screen-reader or keyboard users. If the decision concerns an inclusive experience, those populations and interaction modes need purposeful coverage, not an assumption that aggregate completion stands in for everyone.
The Evidence Reconciliation Matrix: A Practical Triangulation Method
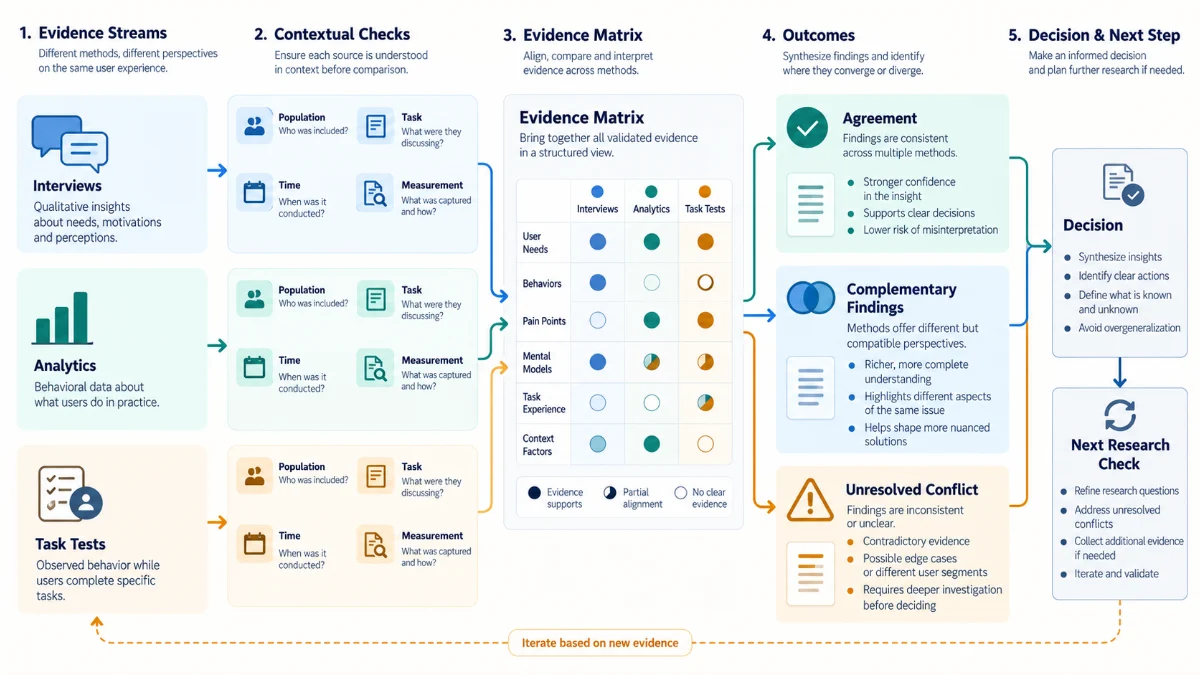
I propose an Evidence Reconciliation Matrix to make incompatible research claims visible before a team combines them. This is my editorial decision tool, not a formally validated scoring instrument. It treats an individual claim as the unit of analysis instead of treating an entire research report as one vote for or against a proposed design.
Each row preserves the observation, its scope, its strength, the most important limitation, and the decision it may influence. The matrix is designed for deliberation: a reader should be able to trace a conclusion to its source and see what would have to change for that conclusion to fail.
A Research Claim Should Carry Its Own Context
| Field | Question it answers |
|---|---|
| Decision question | Which product choice is the evidence intended to inform? |
| Claim and source | What was observed or reported, and where can it be checked? |
| Population and recruitment | Who contributed data, and who was excluded? |
| Task and product state | Which behavior, interface version, and conditions were studied? |
| Time and measurement unit | Which window and denominator apply: person, session, account, or task? |
| Inference boundary | Which conclusion is supported, and which broader claim would overreach? |
| Competing explanation | What alternative could explain the apparent discrepancy? |
| Decision consequence | What action changes if this interpretation is correct? |
| Next discriminating check | What evidence could distinguish the competing explanations? |
UX research triangulation gains discipline when every finding is forced to name its inference boundary. “Users cannot complete setup” may be an overstatement if the direct observation was that three recruited novices needed assistance with a particular prototype. “Setup succeeds” may be equally misleading if an analytics event fires before configuration is usable.
A Six-Stage Reconciliation Sequence
First, write the decision and the population to which it applies. Second, separate raw observations from interpretations. Third, align each evidence source by task, segment, version, period, and unit. Fourth, identify the explanations that could make all findings simultaneously true. Fifth, select the smallest appropriate validation that could distinguish those explanations. Sixth, record a decision with conditions and follow-up rather than manufacturing certainty.
I would also record unresolved differences explicitly. An evidence matrix is valuable even when it concludes that the current research is insufficient. A well-bounded uncertainty is better than a confident recommendation built from incomparable inputs.
Why I Would Not Create One Confidence Average
A percentage derived from product analytics and a thematic observation from interviews are not interchangeable quantities. Giving both a score of four out of five and averaging them creates apparent precision without a defensible statistical interpretation. Even where a team uses structured evidence quality ratings, those ratings should be tied to definitions, not used to turn qualitative quotations into numerical population estimates.
Evidence triangulation is a process for testing interpretations and reducing blind spots, not a formula for converting every method to the same scale. If a high-risk decision requires a population estimate, the next step may be an appropriately designed quantitative study. If it requires understanding a failure mechanism, the next step may be a contextual observation or a carefully specified task test.
Worked Example: Successful Setup, Frustrated Administrators
Imagine a fictional B2B platform that serves small organizations and enterprise accounts. Its team is deciding whether to redesign the account-setup experience. The analytics dashboard shows many recorded setup completions among active accounts. Interviews with newly appointed enterprise administrators describe the process as confusing. A moderated task study reveals that several recruited administrators hesitate at the permissions step and rely on prompts to finish.
These observations are invented for a research-method demonstration. No client dataset, production dashboard, or participant study was used to produce them. There are deliberately no percentage claims because the exercise concerns the interpretation of different evidence types rather than a measured outcome.
The Same Product, Three Non-Equivalent Findings
| Evidence | Defensible observation | Missing context | Possible interpretation |
|---|---|---|---|
| Analytics | Active accounts generate a setup-completed event | Event definition, retries, assisted completion, inactive accounts | Completion is recorded, not necessarily independent success |
| Interviews | Recently appointed enterprise administrators report uncertainty | Recruitment, recollection period, workflow version | Confidence and clarity may be weak in this segment |
| Moderated task tests | Recruited administrators hesitate and request hints | Task instructions, moderator behavior, participants’ prior training | Permissions configuration may be difficult without assistance |
For UX research triangulation, the findings need not be contradictory. A user can finish a task and still feel uncertain about whether it was done correctly. An experienced account owner can complete setup while a new enterprise administrator struggles. Analytics can capture completion after a support representative helps. The apparent conflict begins to resolve once success is defined more precisely.
Competing Explanations That Deserve Tests
Explanation A: The interface has a discoverability problem at the permissions step, but experienced users have learned a workaround. Explanation B: The product works, but enterprise administrators are worried about responsibility and consequences rather than interface mechanics. Explanation C: The completion event captures a technical endpoint while failing to identify incomplete configuration. Explanation D: The three studies involve different user groups and interface versions.
I would not rank these explanations by rhetorical appeal. I would ask which observable result could distinguish them. If event instrumentation is wrong, correct it before inferring a conversion trend. If the study samples differ, stratify the analytics and recruit the relevant administrator segment. If risk perception is central, use scenario interviews and realistic task consequences to explore it rather than changing button labels at random.
Design a Check That Can Change the Decision
A practical follow-up could reproduce account setup for the specific enterprise role, with clearly defined independent completion and no unplanned moderator hints. The team could compare this with event logs to see whether the same milestones are recorded. It could separately ask participants what they believe happens after permission changes and whether that understanding matches the product’s actual behavior.
If the behavior is correct but the consequences are poorly communicated, a targeted explanation or confirmation design may be appropriate. If people cannot complete the task, interface structure may need revision. If the event is unreliable, measurement work comes before a redesign decision. Each outcome supports a different action, which is why the follow-up should be defined before the results are known.
Quantitative Interpretation: Cohorts, Denominators, and False Agreement
UX research triangulation can fail even when the sources appear to agree. Suppose most tracked sessions complete a task and most interviewed respondents describe the task as easy. If both sources primarily represent experienced desktop users, they may jointly hide a serious problem for first-time mobile users. Agreement between similarly biased samples is not independent confirmation.
Define the Denominator Before Comparing Rates
A completion rate can use sessions that started the flow, accounts that created a workspace, people invited to configure it, or eligible users who attempted the task. These denominators answer different questions. Session-level performance may improve while account-level task success deteriorates if frustrated users retry frequently or only returning users remain active.
When reviewing UX research triangulation, I would document exactly which population is in the denominator and which events represent success. If two charts use different units, the numerical difference may be a measurement artifact rather than a change in user experience.
Segment Differences Can Reverse an Aggregate Story
Consider a service whose traffic mix shifts toward experienced users after a product release. The overall completion rate might rise even if both new users and experienced users perform slightly worse within their own groups. This is a possible aggregation effect; the illustration does not describe observed numbers from any product. The practical response is to examine cohorts before attributing an overall change to interface quality.
Useful cohort dimensions may include tenure, role, task frequency, device, accessibility needs, subscription type, acquisition channel, and whether assistance was provided. Segmenting everything indiscriminately can create unstable small groups and spurious stories. I would choose dimensions linked to plausible differences in task conditions and define them before interpreting the result where possible.
Statistical Uncertainty Is Not the Same as Research Disagreement
A small numerical difference can be compatible with sampling variation, measurement error, or a meaningful underlying effect depending on the design and sample. An interview theme can be vivid but not generalizable to a population. A task study can reliably expose a usability defect without estimating exactly how common it is in production.
I would not turn one inconclusive A/B test into evidence that qualitative concerns are invalid. Nor would I use a handful of task sessions to claim an overall conversion change. Methods should be judged by the estimand or practical question they can support, with uncertainty described honestly rather than hidden by a single dashboard number.
Mixed-Methods Research: Design the Connection Between Methods
Mixed-methods research goes beyond conducting an interview and opening an analytics dashboard during the same project. The methods should be integrated around a shared question. The Nielsen Norman Group’s mixed-methods guide describes explanatory sequential, exploratory sequential, and convergent parallel designs, each with a different relationship between qualitative and quantitative work.
Explanatory Sequence: Start With the Pattern
Begin with a numerical or behavioral pattern, such as an unexpected increase in abandonment among a defined cohort. Use interviews or task observation to explore plausible explanations. This works when the measured pattern is valid but its mechanism remains uncertain. The qualitative phase should investigate the actual pattern, not a loosely associated theme selected because it is interesting.
Exploratory Sequence: Start With the Mechanism
Begin with contextual research, interviews, or usability testing to discover a possible barrier. Then design a broader measurement to examine whether the issue occurs within the population relevant to the decision. This is useful when teams have strong descriptions of a problem but do not know its prevalence or commercial significance.
Convergent Design: Collect Independent Perspectives
Collect different forms of evidence during a comparable period, then analyze them against a shared research question. Parallel collection can improve efficiency when conditions are stable and the methods can be designed independently. It still requires careful integration; a set of synchronized dates does not automatically make tasks, populations, and definitions equivalent.
My preference is to choose the design around what is unknown. If analytics is valid but unexplained, explanatory work is appropriate. If the need itself is unclear, exploratory work should come first. If a consequential design change requires different types of contemporaneous evidence, convergent work may be worthwhile. UX research triangulation becomes more credible when this relationship is intentional rather than retrofitted after the results arrive.
A Research Decision Trace: From Evidence to Product Action
An evidence matrix explains what each source can support. A research decision log preserves what the team chose to do with that understanding. I would keep a compact record of the decision question, candidate interpretations, evidence boundaries, chosen action, unresolved risk, and the conditions that require reconsideration. These are proposed fields for an editorial framework, not evidence that a particular company uses this process.
| Record element | Illustrative decision |
|---|---|
| Decision | Whether to redesign enterprise account setup |
| Current observation | Reported uncertainty, task hesitation, and recorded completion coexist |
| Main uncertainty | Independent task success versus technically recorded completion |
| Evidence limitations | Different cohorts, task contexts, and event definitions |
| Next test | Validate completion instrumentation and run realistic independent tasks for the target role |
| Provisional action | Do not commission a full redesign on the current evidence alone |
| Reconsideration trigger | Confirmed task failure or evidence of a consequential mental-model mismatch |
In UX research triangulation, the record should preserve dissent when the evidence supports more than one interpretation. If a researcher believes the problem is conceptual and an analyst believes the event is defective, both explanations should remain visible until a relevant check discriminates between them. Consensus by meeting attendance is not research validation.
Evidence Confidence Should Be Explained, Not Decorated
I would describe a finding as well supported, supported within a limited scope, provisional, or unresolved, with a short explanation of the evidence. This is a proposed qualitative reporting convention rather than a statistical confidence scale. It forces the review to say whether an issue is directly observed, inferred from a proxy, or proposed as a hypothesis.
UX research triangulation can still end with a decision under uncertainty. The issue is whether leaders know which assumption they are accepting and what would change their choice. A reversible copy or navigation adjustment may justify a lighter research burden than a structural redesign that disrupts training, accessibility, or business-critical workflows.
Preserve an Audit Trail Without Exposing Participants
Evidence traceability does not require putting identifiable interview data in a widely circulated report. A decision log can reference secured study records and anonymized observations while maintaining participant consent, retention rules, and organizational access controls. The GOV.UK guidance on research notes and recordings emphasizes consent and secure handling of personal information.
For product teams, the practical advantage is that later reviewers can understand why an action was taken without repeating interviews or guessing at the dashboard filters used during the original discussion.
Automated UX Analysis Is a Signal, Not a Replacement for Research
Automated inspections can identify technical issues such as small touch targets, missing structural cues, contrast problems, and certain layout conditions. These findings can be valuable inputs, particularly when a team needs a repeatable review of observable interface properties. They cannot tell us whether a person understands a complex permission model, fears the consequences of a decision, or uses an unexpected workaround in daily work.
My public UX Analysis Tool is an example of a utility focused on inspectable usability and accessibility signals. I would treat its output as one evidence source with a defined scope, not as proof of user sentiment, population behavior, or real task completion. A tool can report a detectable issue without determining how severely it affects a particular audience.
This distinction matters for UX research triangulation because automated scores can acquire unwarranted authority simply by being reproducible. Repetition makes a technical check consistent; it does not necessarily make it relevant to the decision under discussion. When automated inspection and participant observations differ, I would ask whether they assess the same property rather than deciding that one should override the other.
Where Triangulation Can Mislead a Research Team
The first failure in UX research triangulation is false consensus. Multiple methods can share the same exclusion. If interviews, analytics, and task sessions all omit people who use assistive technology, their agreement does not establish accessible task success. Repeating the same recruitment bias across methods can amplify confidence while leaving a meaningful blind spot.
The second failure is forced causation. Product analytics can show a change following a release; interviews can provide plausible reasons; task observations can demonstrate a usability mechanism. Together they can strengthen an explanation, but they do not automatically isolate the release as the cause of a business outcome. A causal claim may require a controlled comparison or stronger design than the available observational evidence offers.
The third failure is treating participants as interchangeable. An administrator responsible for compliance has a different risk model from an employee completing a routine action. The same flow may be efficient for one and intimidating for another. The product can satisfy one audience while genuinely failing another, without any measurement being wrong.
The fourth failure is overresearching a reversible decision while underresearching a consequential one. I would scale the reconciliation effort to the decision’s impact and the risk of being wrong. A minor label test may need a focused check; a redesign of a critical enterprise workflow may justify multi-method research and more careful segment coverage.
The fifth failure is allowing an interpretation to become permanent after conditions change. User groups, task requirements, instrumentation, and product behavior evolve. A research finding should retain its version and scope so it can be reconsidered when the environment no longer matches its assumptions.
Evidence, Methodology, and Limits of This Article
This article draws on published Nielsen Norman Group research about triangulation, contradictory findings, mixed-methods studies, participant selection, and qualitative analysis, together with GOV.UK’s guidance on planning user research, usability testing, research notes, and evidence synthesis. Those sources justify checking methodological fit and combining evidence deliberately. They do not independently validate the particular matrix or decision trace proposed here.
The fictional enterprise setup case, competing explanations, evidence rows, and provisional decision are constructed teaching examples. No participants were recruited, no interviews were conducted, no analytics events were inspected, and no usability benchmark was measured for this article. The Evidence Reconciliation Matrix and research decision log are editorial synthesis tools for organizing future real analysis, not reported results from an experiment.
The framework also has limitations. It cannot recover missing user groups, verify a broken data pipeline without further technical work, or establish population prevalence from a small qualitative study. In highly regulated or safety-critical contexts, a formal research, accessibility, privacy, and statistical review may be necessary before a consequential product change.
How I Would Run a Disagreement Review
I would begin by bringing the researchers and decision-makers back to one concrete question. Each evidence owner would present their strongest observation with the underlying task, sample, time period, measurement unit, and limitations. I would ask them to state what their data does not show before presenting the action they recommend. That ordering makes it harder to mistake interpretation for observation.
Next I would align the comparable parts of the evidence and isolate what remains different. Some findings will prove complementary. Some will apply only to a particular segment or version. Some will remain genuinely conflicting. For the unresolved cases, I would choose a check that could lead to a different product decision, and document which result would justify continuing, changing scope, or stopping the proposed design work.
Finally, I would preserve the result in the decision record and make the research trace accessible to the people implementing the change. Better UX research triangulation does not merely create a more persuasive presentation. It helps teams make decisions that are appropriately confident, honest about limitations, and easier to revisit when new evidence arrives.
For related design and usability context, see my UX & UI Design Expertise overview. The UX & UI Design Articles collection brings together additional reading across interface design, research, and product experience.
Frequently Asked Questions About Conflicting UX Research
Should analytics override interview findings when the sample is larger?
Not automatically. Larger data volume can describe an instrumented behavior more precisely while remaining unable to explain motivation or an untracked task requirement. First verify the population, event definitions, and question each method answers. A large dataset is not decisive evidence for a claim it does not measure.
Do contradictory interviews mean the qualitative research was unreliable?
No. People may occupy different roles, possess different levels of experience, or encounter different conditions. Contradictions can expose meaningful segmentation or a limitation in recruitment. They become a methodological concern when the study’s claims extend beyond what the observations support.
Why can users finish a task and still say it was difficult?
Completion and perceived difficulty are different outcomes. People may succeed through repeated attempts, reliance on help, learned workarounds, or uncertainty about whether they acted correctly. A study should define independent success, assistance, accuracy, and subjective experience separately when those distinctions affect the decision.
Can five usability participants prove that a problem is common?
A small qualitative study can reveal concrete problems and offer evidence about why they occur, but it does not by itself establish population prevalence. A frequency claim needs a suitable sample, measurement, and uncertainty analysis. Five is not a universal statistical justification.
How many methods are required for UX research triangulation?
There is no universal required number. Two complementary methods may answer a focused question, while a consequential, ambiguous decision may warrant several forms of evidence. What matters is that additional methods contribute independently useful information and address the uncertainty relevant to the decision.
What should a team do when evidence remains unresolved?
State the uncertainty, identify the plausible competing explanations, and choose the smallest appropriate check that could change the decision. If the choice is reversible and low risk, a monitored pilot may be reasonable; if it is consequential, defer the major commitment until the relevant evidence is stronger.
Conclusion: Reconcile the Claims, Not the Headlines
When interviews, product analytics, and usability tests disagree, the research has not necessarily failed. The evidence may describe different people, different meanings of success, or different moments in the product’s life. The mistake is to erase those differences in pursuit of a single answer that looks certain enough for a roadmap slide.
My preferred approach to UX research triangulation is to preserve the provenance of each claim, define its inference boundary, test the explanations for disagreement, and carry the remaining uncertainty into the product decision. An evidence matrix makes the reasoning inspectable. A decision trace records what the team chose to do with it and what would justify changing course.
The outcome I want is not agreement for its own sake. It is a decision that makes sense for the users and conditions it actually concerns, and that remains open to correction when better evidence appears.
Connect and Explore My Work
I share perspectives on UX research, interface design, product decisions, software engineering, and digital systems through LinkedIn, X, and Threads. My public technical work is available on GitHub, while my visual design portfolio is on Behance.